'%3E%3C/circle%3E%3C/g%3E%3C/svg%3E)
Open travel emissions data
Emissions data is hard
A few weeks ago I wrote an introductory blog about a new project on carbon emissions data. We have been working with Lowr to help them create a first version of an open repository or catalogue for credible data on emission factors for use in their app. This first version starts with travel emissions, which is the UK's largest source of CO2 emissions.

Credit: Greenhouse gas emissions by sector (BEIS, 2022)
They need reliable data covering most types of transport. As it will be used in an app, it also needs to be machine-readable. We knew this project would be an experiment for us because we are experts in data, not carbon emissions. We also knew that emissions data is difficult, not least because of the many assumptions that go into producing it, but also because of the apparent lack of availability of emissions data.
Our initial thoughts were that a standardised database of emission factors probably already existed, even if finding it wasn’t straightforward. We were wrong. From our initial research, it seemed there wasn’t an obvious “go-to” source for emissions data. But myriad websites were claiming to be CO2 emission calculators or data providers with a paywall. Some of these looked good on the surface, but often it was hard and sometimes impossible to find where their data was coming from. In the end, we did manage to find a few good sources, which I detail in the rest of this post. The UK government set was the most useful and well-documented, and it’s what we’ve based our first attempt on. We found lots of sources that were outdated, not openly available, or both of those things.
Our first attempt
We began with a Google search of “travel emission factors”. The top result was a link to a UK government website for guidance and methodology to calculate journey emissions. I instantly jumped to the “data sources” section. The data was based on the Department for Business Energy and Industrial Strategy (BEIS) conversion factors, which are published annually.
There was a link to a page with 7 different Excel spreadsheets, one of which was labelled for “advanced users only”. The file is complicated. There are 26 different sheets, which all have different formats and lots of data notes and guidance. Fortunately, there was also a flat file (about half the file size too) which is a much better format for automatic processing. Instead of lots of different sheets, the data is all stored in one long table with only a few columns. This has several advantages when dealing with the data programmatically.
I set up a pipeline using DVC to import the raw data file into the project repository. This automatically tracks the file for updates. If there are any changes to the file the pipeline will automatically download the latest version of that file. The downside with this method is if the URL changes the import won’t work. But I’m not sure there is a more robust method for data published this way. The next publication will likely be on a different page. Fortunately, this isn’t until June 2024.
There were a couple of problems with the data that I wanted to fix. Firstly, I filtered out anything that wasn’t a mode of transport. This left me with emission factors for cars by size, cars by market segment, motorbikes, buses, taxis, flights, ferries, and rail. I only included conversion factors for kilograms of CO2 equivalent (kg CO2e). This is effective CO2 mass, including non-CO2 related emissions (e.g. CH4, N2O). I also removed any duplicate entries. One column was titled “Column text” and it contained different types of information depending on the type of transport. For example, for cars, it was the type of fuel, whereas for flights it was whether it indirect emission effects were included or not. I split these different types of information into different columns. Lastly, I renamed all of the columns to something more meaningful. The current file structure is pictured below.

I think this is fairly robust, and it would be easy to add other data to this. I am very open to suggestions for improvement. Overall, this has left us with a simplified dataset covering most types of transportation. There is another file which describes the different types of cars and haul lengths of flights. These were extracted from comments on individual cells in the Excel file. To use the data you would multiply the emission factor for the mode of transport you used by the number of kilometres you travelled.
Tracking down the source data
I was interested in how easy it would be to have more granularity in the data. For example, could you calculate emissions for a specific make of car? This type of information is usually available directly from manufacturers, but as the Volkswagen emissions scandal showed, it isn’t always trustworthy.
I wanted to see if the source data was available openly, which would be a big bonus. The methodology for BEIS emission factors is published in a 153-page report. I have read the sections for the data we are using. My key takeaways from reading that document are as follows:
- It was often very hard to find the true source of the data. I was led down several rabbit holes of links to websites, PDFs and data hubs.
- The Ricardo Consortium, which manages the National Atmospheric Emissions Inventory (NAEI) contract, produces the final emission factors.
- There are many different standards for reporting CO2 emissions. E.g. for cars, there is the New European Driving Cycle (NEDC) and World Harmonised Light Vehicle Test Procedure (WLTP).
- There are several real-world “uplifts” applied to emission factors to account for real-life conditions. These can be surprisingly simple. For example, car CO2 emissions are weighted by the ANPR data for road usage statistics.
- Most of the factors have considered a wide variety of data such as passenger statistics, fuel consumption, market share of different modes of transport and historical trends.
I was able to find several data sources from the methodology report. This was a lengthy process which highlighted to me the importance of what we are trying to do.
SMMT
The Society of Motor Manufacturers and Traders (SMMT) provide numbers of registrations and average gCO2/km figures for new vehicles. This includes NEDC factors for cars between 2005-2019 and WLTP factors from 2020 onwards. The SMMT dataset is comprehensive as it represents “essentially all vehicles” from 2001 onwards. You can buy data from their site here. For example, data for something as specific as the fuel types for new BMWs registered in the UK in 2023 costs £1777.46.
VCA
The Vehicle Certification Agency (VCA) has data on the emissions of different makes and models of cars on this site. They have used-car data that goes back to 2001. There are gaps in the data though. It wasn’t entirely clear what their source is, but I think manufacturers submit data to them directly. For new cars, if I select BMW from the list, there is no available data. The used-car data seems quite complete, however.
EEA
The European Environment Agency (EEA) publish data on new cars that have been registered in the EU each year. Each member state must submit information about the car such as manufacturer, model, fuel type and WLTP CO2 emissions. On the plus side, this is a well-documented site with an API that works and has emission factors for individual car models. The downsides are several; the data only goes back to 2010, ruling out older cars; we are no longer in the EU, although according to the site, data for the U.K. is available in the main database (although it wasn’t clear what that was). I ran a query on their API to test what data was available in the U.K., and it turns out it only has data from new cars in 2010.
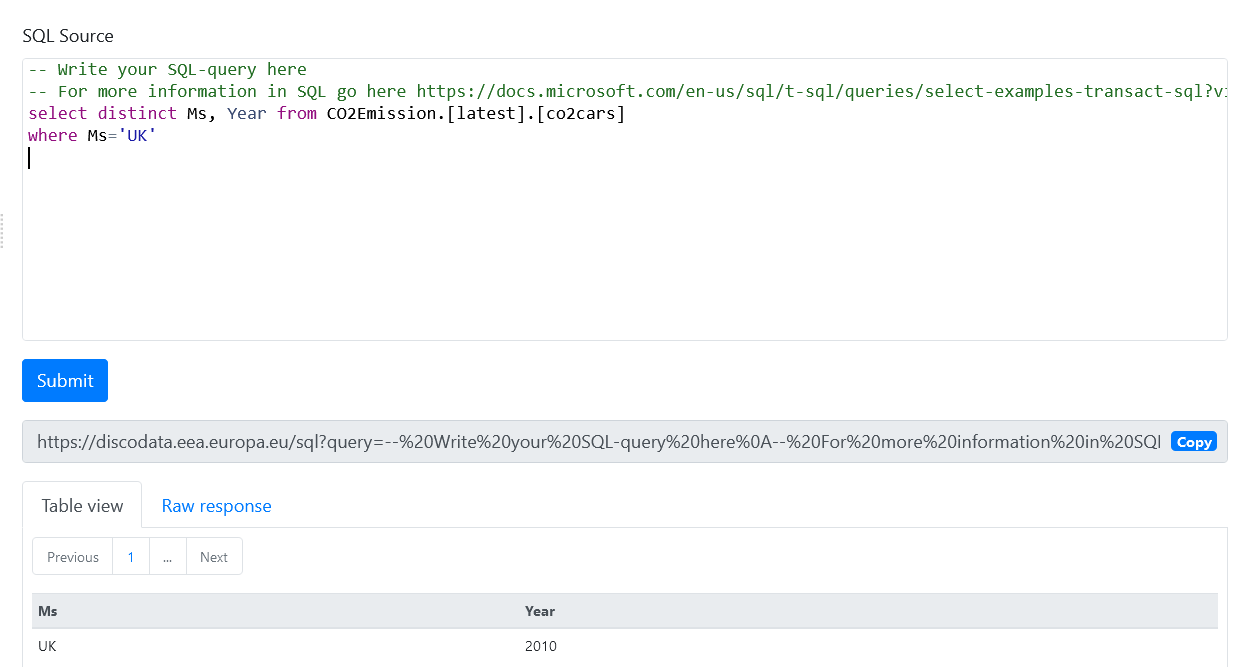
Credit: https://discodata.eea.europa.eu
Clear
Clear provides data on motorbikes from a mix of road test reports and user-reported data. I couldn’t find any data on their website. However, they do have an emission offset tool. I’m confident the data would be available (perhaps at a cost).
IEA
The International Energy Agency produce emissions data. It costs 610 euros to pre-order the 2023 dataset for one user or 2990 euros for unlimited users. The site looks good and there is a full methodology available. The available data and its structure are not obvious. But this is what BEIS use for their international rail emissions factors.
EUROCONTROL
They publish a flight emission tool here. Average flight emission factors are calculated with weightings according to the type of aircraft and the number of passengers (provided by DfT) You could use this tool to estimate the individual CO2 emitted for a given flight, but you’d need to know the number of passengers on the plane too.
Climatiq and IcebreakerOne
Climatiq and IcebreakerOne are similar services. They provide open API access to emissions data. I noticed that Climatiq had the BEIS data in their system. Climatiq provides free non-commercial use or paid access for commercial purposes. I posted on LinkedIn about this project and Gavin Starks (IcebreakerOne CEO) said this:
Hah! Well now, there's a story... in 2008, this small startup called AMEE raised $2M to build an open API solution for carbon calculation. In 2021, this small startup called Climatiq raised $2M to build... something very similar…
Close, but no cigar
This is a list of datasets I could find that BEIS used in calculating some of the travel emission factors, but don’t contain emission factors directly:
- Office of Rail and Road Statistics rail emissions
- Association of Train Operating Companies data hub
- Bus usage statistics
- Bus Service Operating Grant Rates
- BSOG payments
- I was unable to find the source data for ferry emission factors.
- For London taxis: “The data was provided by TfL in a personal communication and is not available in a public TfL source”. For other taxis, they used the emission factors for medium and large cars with the same uplift factor as black cabs applied.
Summary and Final Thoughts
It feels like emissions data is intentionally difficult to find. Our work so far is a good starting point, and it's open to use for everyone. But we are surprised that much of the data is locked behind paywalls or extremely difficult to track down. Whilst you can get your hands on an emission factor, there’s always another layer hidden beneath. It is also clear that there are many different data providers, but it’s not easy to tell who is using the same data or which provider you should choose. We want people to calculate their CO2 emissions because they care about the environment, not just their image. And for that to work, we need the most reliable data available to be put in one place for anyone to use.
We have shone a small light into the murky depths of CO2 emissions data as it stands. It’s clear that the only way to make this easier is by working in the open. How can we get more precise information all in one place? We welcome your suggestions. If you think you can help, please contribute to the GitHub repo, or email me at luke.strange@open-innovations.org