'%3E%3C/circle%3E%3C/g%3E%3C/svg%3E)
Youth employment in UK constituencies
We are now wrapping up another successful phase of work with Youth Futures Foundation, who continue to impress us with their vision and approach to sharing data and working openly.
In our initial work with Youth Futures, we created their economic data dashboard which visualised some of the key research and analysis undertaken by the organisation. We helped them to publish their key findings, answering questions like - where are the data gaps for understanding economic outcomes for marginalised young people, and, from the data that is available, what can we tell about the experience of young people in the job market?
Throughout our second phase, we focused on building robust automated analysis pipelines to ingest, process and visualise live economic statistics on topics such as the labour market, employment, young people who are NEET - that is, not in education, employment or training - inflation and the number of employment vacancies in the UK over time.
This starts to build a picture of the national economic landscape and the challenges faced by young people, but we know that the picture is not the same across the UK. In this phase, we’ve taken a closer look at the data at smaller geographies, with a particular focus on constituency-level analysis which, in light of the recent news of a general election, has come at the right time.
Regional economic analysis
You’ll notice that we have added a new Areas section to the Youth Futures website. We’ve added a number of new visualisations and features to explore economic datasets at a local level.
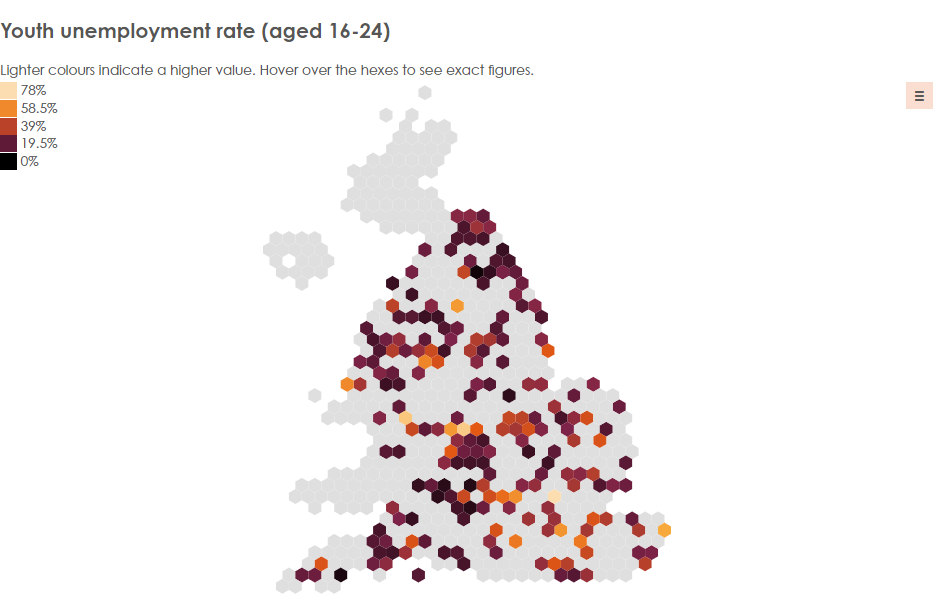
We started with Employment, presenting data on the rates of unemployment, economic inactivity and universal credit claimants by parliamentary constituency.
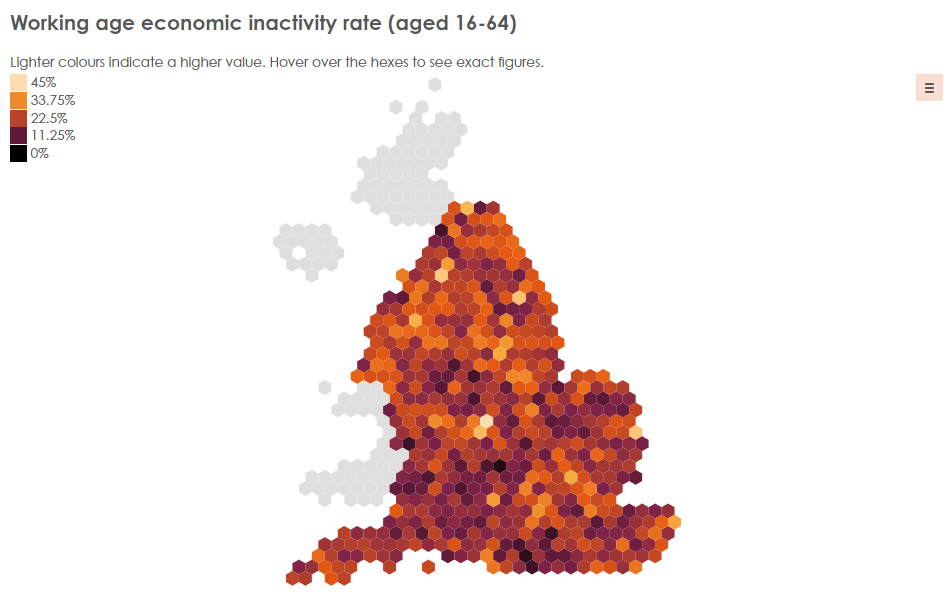
Credit: Open Innovations; Youth Futures Foundation
We have also presented data on Education and skills for young people by English local authority. Here, we wanted to see how local authorities compare in terms of the level of education attainment and progress at Key Stage 4 level, so we developed a new chart type to see how local authorities ranked against each other.
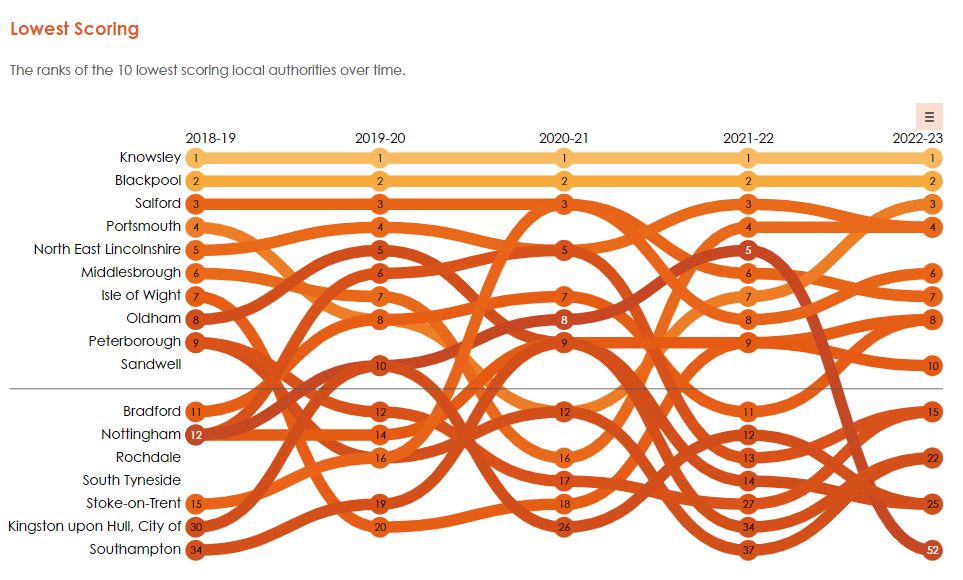
Credit: Open Innovations; Youth Futures Foundation
NEET Factors
Youth Futures have done a wealth of analysis into the factors that contribute to a young person becoming NEET. The extent and degree of overlap between these factors, meaning the different forms of marginalisation that a young person experiences, can increase the likelihood of them not being in employment, education or training.
To quantify this, Youth Futures developed a standard score against each factor per local authority, resulting in the map below which shows the likelihood of a young person becoming NEET across the country.
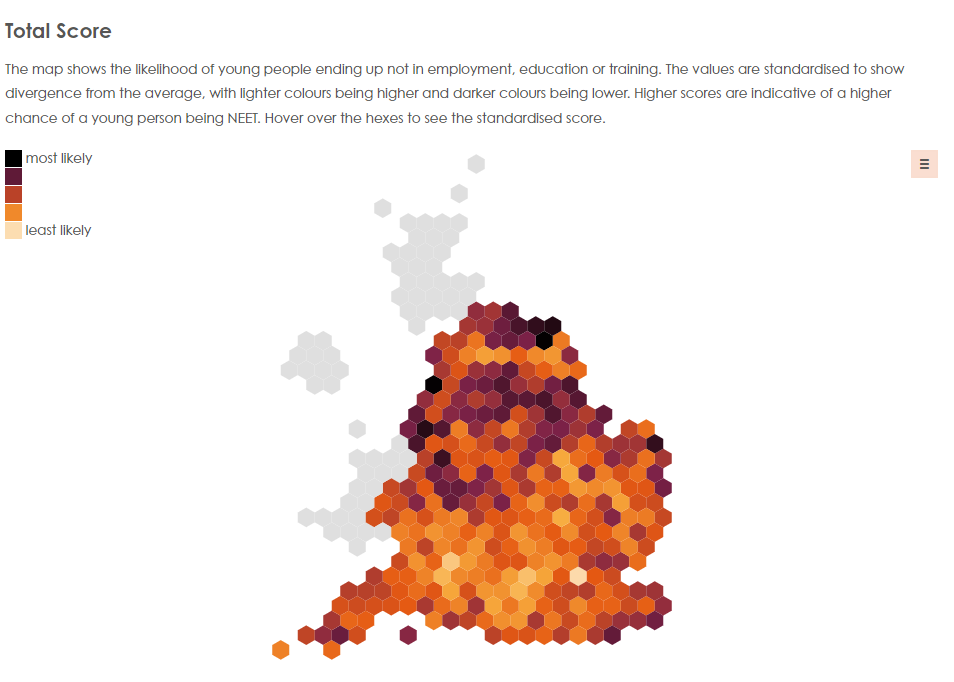
Credit: Open Innovations
This map presents a number of NEET indicators that we processed from live open sources, meaning the visualisation will update as new government statistics are published.
Presenting the data in this way helps Youth Futures and other organisations to focus their interventions in the areas that need it the most, and to ensure that they are seeing the most up to date information to steer their decision-making.
Exploring constituency data
To go even further in exploring England’s local economic profiles, we have developed an MVP Constituency Lookup tool that will be developed going into the next phase of our work with Youth Futures.
The tool provides a dashboard view of data pertaining to every parliamentary constituency in England. Currently, the dashboards contain information on employment and education, but we have plans to develop the tool into a comprehensive resource on constituency-level information that is relevant for young people - where the data exists (see below).
If you’re interested in this data, we have also built a standalone Constituencies repository that collates a number of datasets across themes covering economics, health, energy, transport and others. We encourage people to get involved and contribute to our open repositories, so get in touch with us if there are any specific datasets you’d like to see on there.
International Comparisons
We are not only interested in how UK regions compare against each other, but also in how the UK as a whole compares with other countries in terms of economic outcomes for young people.
To understand this, we’ve taken international data on economic indicators from OECD countries, and visualised them on an International Comparisons page. This tells us how OECD countries compare in terms of NEET rate, employment, unemployment and economic inactivity rates, as well as incidence of high and low earners. We’ve ranked countries to see how they compare against each other.
Data Infrastructure
With all of this work, our aim is to create the necessary data infrastructure for organisations such as Youth Futures to make informed decisions about where to direct their efforts, to know what help is needed and to help them make the strongest impact.
Part of the value - and the challenge - of building these assets, like the Constituency and OECD comparison tools, is to highlight the gaps in existing data, research and infrastructure. As you can see below, much of the data published openly by the government at this level of granularity is increasingly scarce.
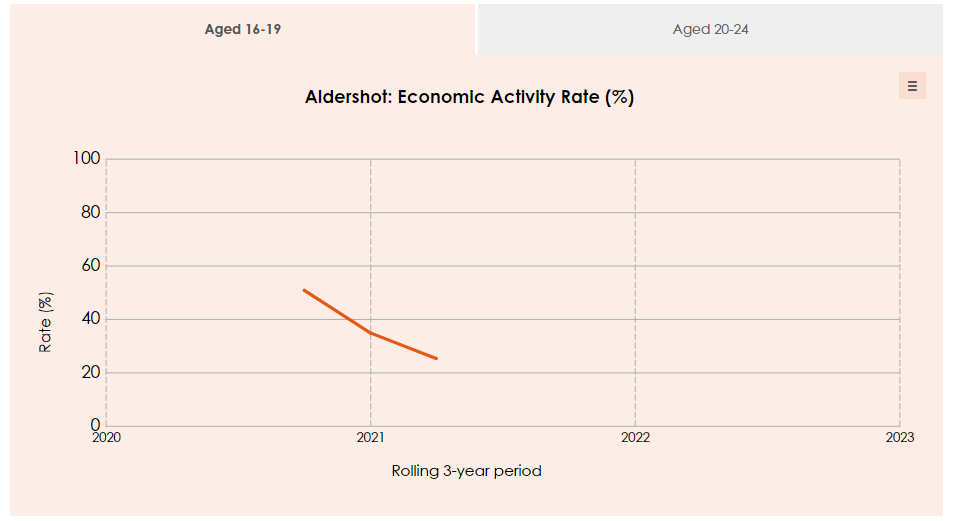
Credit: Open Innovations
Credit: Open Innovations
This is because the ONS is facing a challenge of falling response rates to household surveys, as have other comparable countries. This was especially true for the Labour Force Survey (LFS) data collected late last year, for which publication was suspended by the ONS due to data quality concerns.
To address this, the ONS released a plan to reform its methodology for LFS data collection. Alongside this, they are transitioning to the Transformed Labour Force Survey (TLFS), which became the primary source of labour market data from March 2024. Thankfully, this has seen an increase in response rates and reduced variability across regions.
Going forward into a future phase of work, we will review how we present labour market data in light of the reformed LFS release. We are hopeful we'll see greater coverage at lower geographies, to enable more granular analysis of economic indicators most relevant for young people.
What next?
We are looking forward to continuing our hugely rewarding relationship with Youth Futures Foundation in the year ahead. We intend to build on the Constituencies feature in the dashboard, presenting more data on demographics and population, employment and income, poverty, benefit claimants and much more.
We always welcome comments and suggestions for where we can take our data projects next. If you're interested in this data, get in touch with us at hello@open-innovations.org. A huge thanks again to Andrea Barry and the team at Youth Futures Foundation, and to our sponsors network for their ongoing ideas and support.