'%3E%3C/circle%3E%3C/g%3E%3C/svg%3E)
Launching The True North Data Explorer
How Does The North Win?
In March 2024 we hosted a "How does the North win?" conference, with the aim of defining what "winning" means for the North and how to quantify it. Brabners, an independent law firm based in the North, created a True North Network with a similar aim.
We want True North to be a network of like-minded organisations committed to supporting the future of the North, uniting the region's most influential and purpose-driven voices to co-create a path forward with a view to unlocking the true potential of the Northern economy"
We think this is a great example of how the North can win, and this week we launched the first version of a microsite - the True North Data explorer.
What is the True North Data Explorer?
To show their commitment and serious attitude to understanding the economy of North England and the role True North can play, Brabners asked us to help create the True North Data Explorer. The Data Explorer is high quality real-time Data Infrastructure that accesses open data pipelines created and built by us. It also uses data relating to the economy at company level, provided under licence by The Data City.
The explorer is an open web-tool that will enable the True North network and its advisory council to use data to ask & develop the right questions and identify opportunities for action across the North. Brabners identified 4 key themes as crucial to achieving progress across the North. These are:
- People, Skills & the Future
- Innovation & Change
- Sustainable Growth
- Purpose & Social Impact.
We have created interactive visualisations for each theme using relevant open data. These visualisations can help to demonstrate the current economic situation of the North.
How Did We Develop The Explorer?
We were able to build this microsite at pace and visualise new data and findings because of our previous work, experience and our relationship with the Data City.
Economic Data Dashboard (EDD)
We have developed our own economic data dashboard (EDD). EDD is a collection of economic data from sources like the ONS put into a consistent format in machine-readable files. We can rely on this data to be up-to-date, and we know when it will update in the future, because it's built programmatically. This allows us to build reproducible pipelines that pull the data we need into the site.
Reproducible Pipelines
Our open approach means we can stand on the shoulders of others. For example, we used data from our work with the Youth Future's Foundation data dashboard to recreate their visualisation of the risk of young people not being in employment, education or training (NEET). Since their research and data are published openly on the web, we have re-used their data in a new context, without spending the time and resources trying to recreate it. We have credited them and linked to the original work - using the web as it was intended #RadicallyOpen.
Not all the data we needed was in a usable format, however. For example, data on the distribution of levelling up funding, or graduate retention rates. We spent lots of time unravelling confusing tabular formats. Or, in the case of levelling up funding, attempting to match things like the "name of lead applicant organisation" to a local authority, so we could show the data on a map. By publishing what we have done in the open, we hope to save people from repeating this work.
A Hunch Without Data Is Just Vibes?
Brabners had an instinct that purpose-driven businesses were potentially a driving force across the North. They asked for our help to see if we could quantify this. We employed a few different methods to consider this hypothesis.
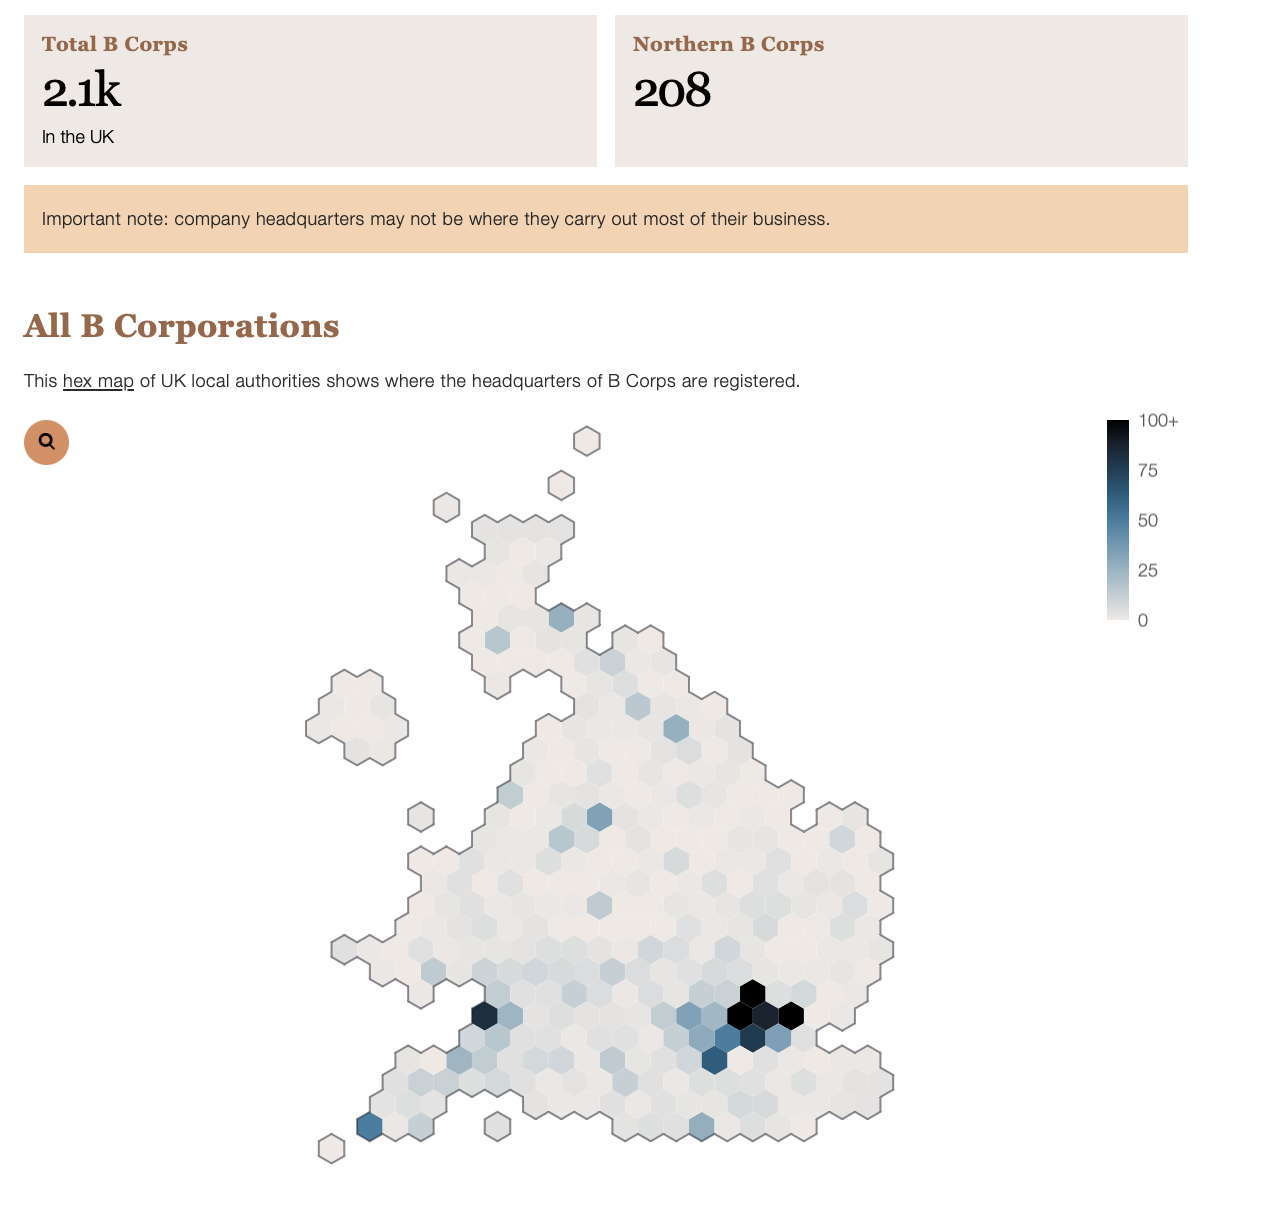
- B Corp Certification is a designation that a business is meeting high standards of verified performance, accountability, and transparency (Brabners themselves are an accredited B-Corp). Through web scraping, we were able to put B Corp membership data into a machine-readable format to try to understand the economic impact of other similar businesses across the North. We have local authority breakdowns for all B Corps, by size of company, by ownership, and by sector. Our Data Explorer is the first time that this data has been visualised in an accessible manner.
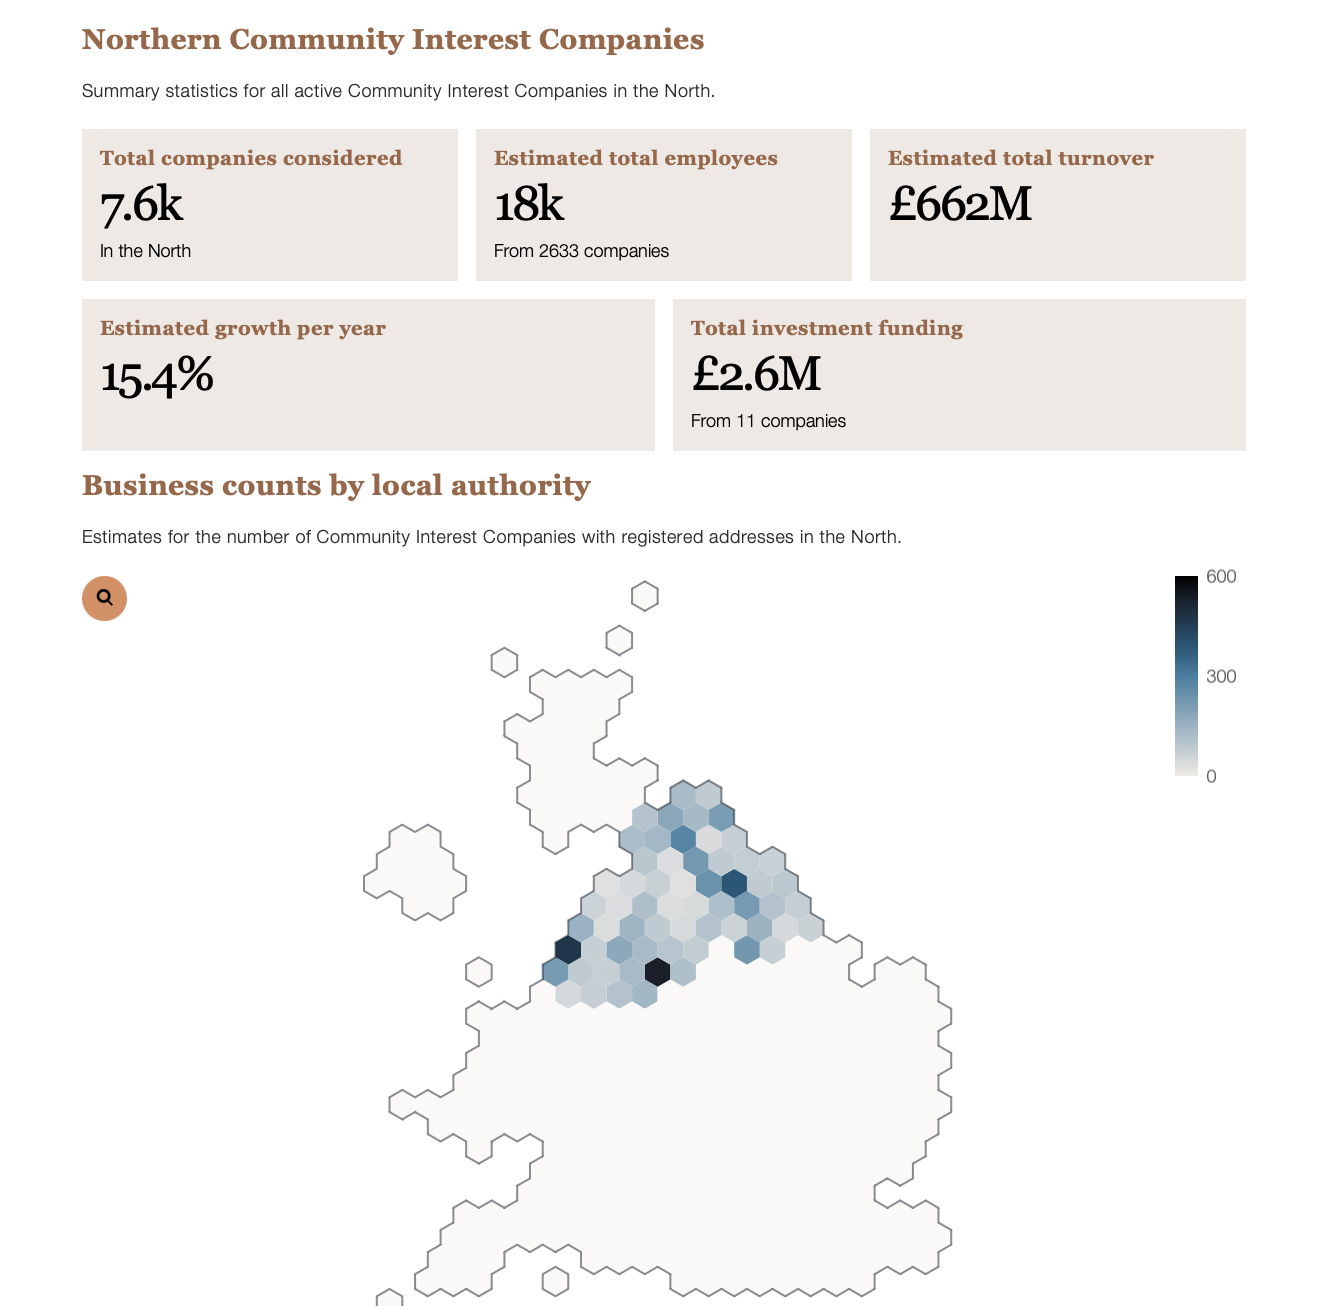
- In another first, we mapped data for owner-managed companies, Not-for-Profits and Community Interest Companies.
- Using True North's membership data, we created a True North Impact Dashboard. It allows them to measure themselves.

Some Highlight Findings
Summary of North England's Economy
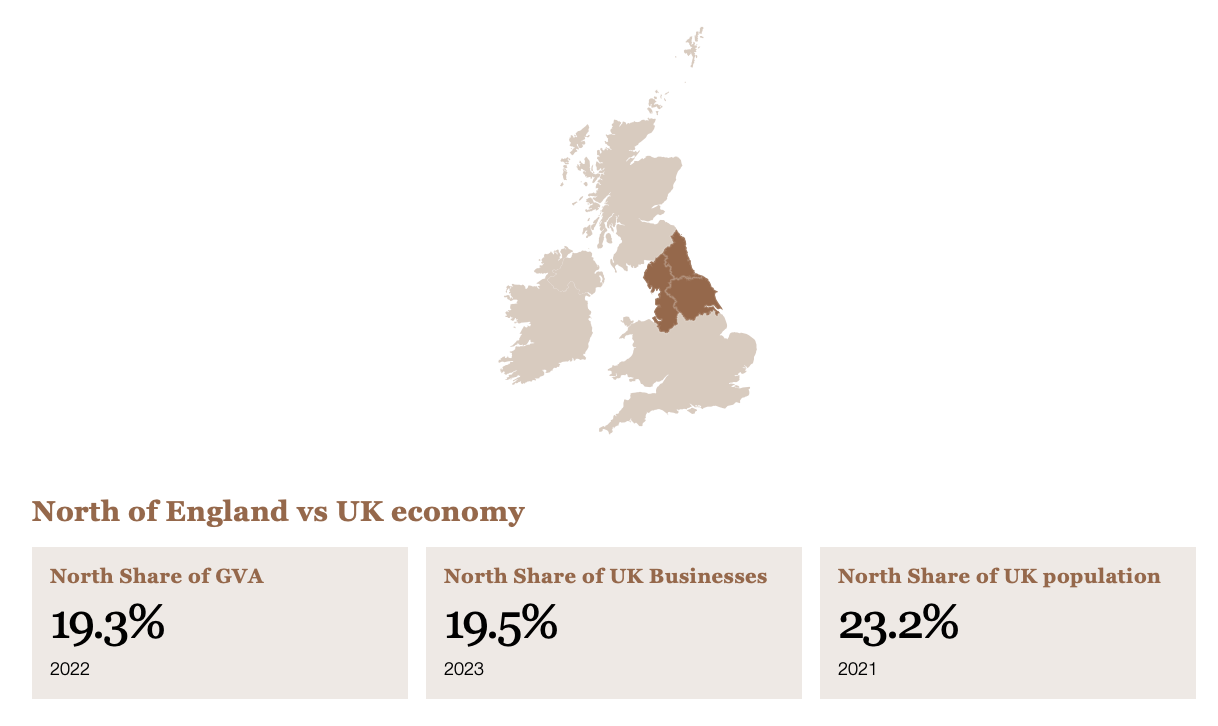
Fastest Growing Sectors in the North

Business births and deaths

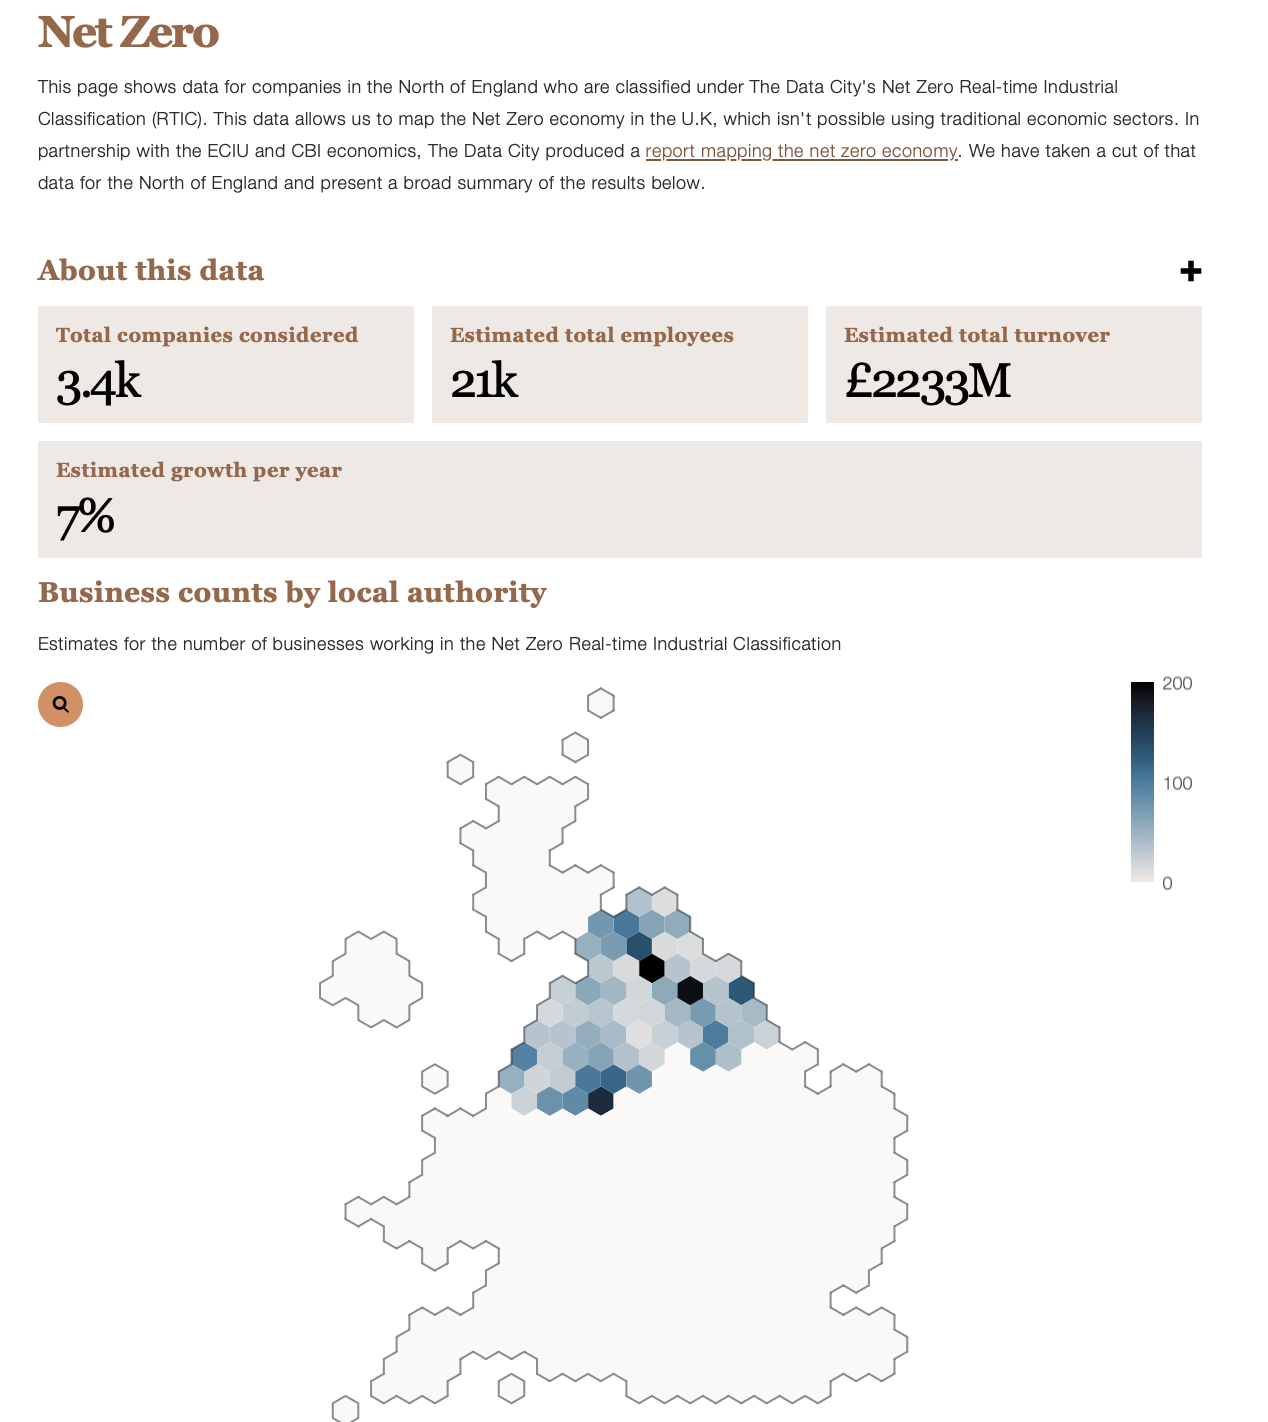
Net Zero Economy
Levelling up funding

Why is it important?
The True North Network is committed to supporting the future of the North. The data explorer allows the network to make data-led decisions, which will inform specific programmes aligned with local needs. Above all, the Data Explorer will allow True North to start asking the right questions and to help identify areas most in need of support. There is focus is on metropolitan areas, where there may be hotspots of economic success or, conversely, where deprivation is more prevalent. The Data Explorer can be used to highlight success stories, as well as opportunities to address deprivation.
Even though we can't yet make highly detailed conclusions - it's a great place to start. By providing True North with relevant and digestible information, the explorer allows us and them to start asking the right questions.
The site is live, and will continue to evolve and improve over time. It's also an open resource that other people can contribute to. If you find a relevant dataset or know something can be updated, then please get in touch at hello@open-innovations.org. In phase 2 we will be asking more detailed questions. We will look at even more targeted geographies and show comparisons of the data across the North compared to the rest of the UK.