'%3E%3C/circle%3E%3C/g%3E%3C/svg%3E)
The World of Housing
Housing Open Data
Housing is at the forefront of the UK's political discussion. In her first speech as Chancellor, Rachel Reeves announced her commitment to "Get Britain Building again", promising 1.5million new homes over the next 5 years. Housing is an area that we've got quite a lot of experience in. Last year, our Head of Data, Tom Forth, appeared on Channel 4 to discuss the housing crisis.
"France built 380,000 [homes] and they were a bit disappointed, whilst we were celebrating 240,000 the French were like 'oh dear, we've missed our target'," says Tom Forth, Head of Data at Open Innovations about Britain's housing crisis. pic.twitter.com/CV1uRxePCy
— Channel 4 News (@Channel4News) July 27, 2023
Using open data, we've created tools and visualisations for different aspects of housing, from vacant homes to brownfield site capacities. We want to build on the good work we have already done, so we are launching a new housing-specific project. Over the next few months, the team will be gathering data to create insights into the world of housing.
What We've Done Before
We have done a lot. Searching "Housing" into our website will give you 56 results. Here are some of the highlights:
Tools:
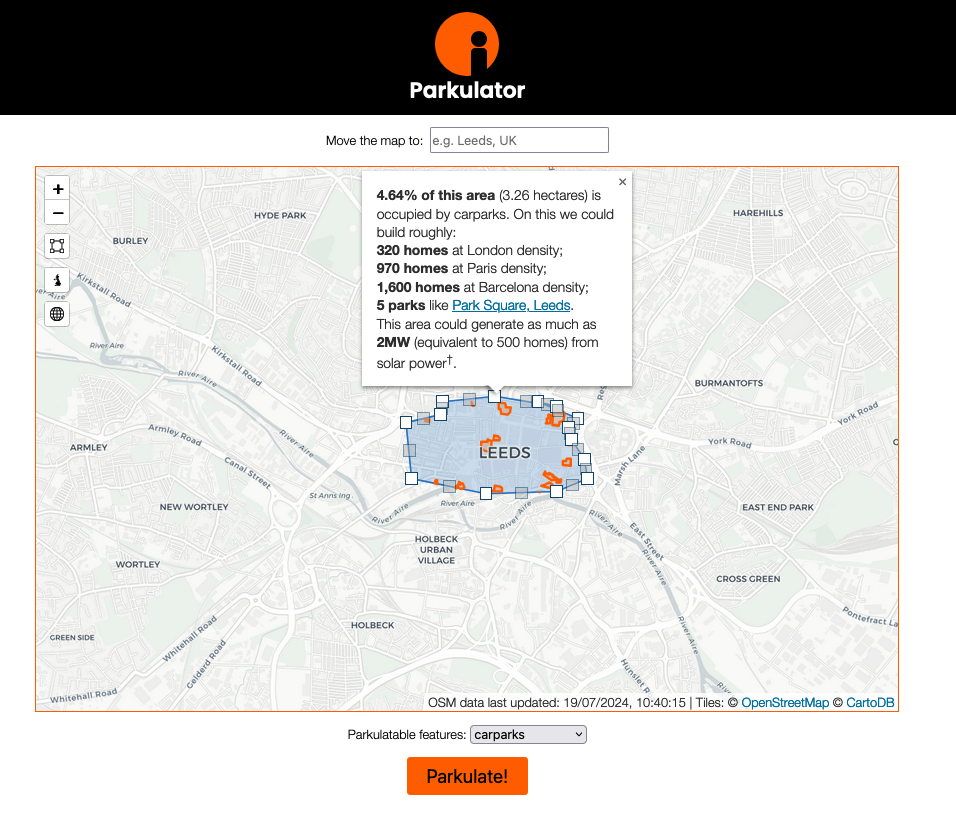
- Parkulator – Tom originally created this tool in 2015 to calculate the amount of land used for parking within a user-selected map area. Thanks to Stuart, it has evolved into displaying how many houses could be built on land currently used for car parks, golf courses or on brownfield sites. It also estimates how much energy could be provided from new solar farms. Have a play around, and read more about it here.
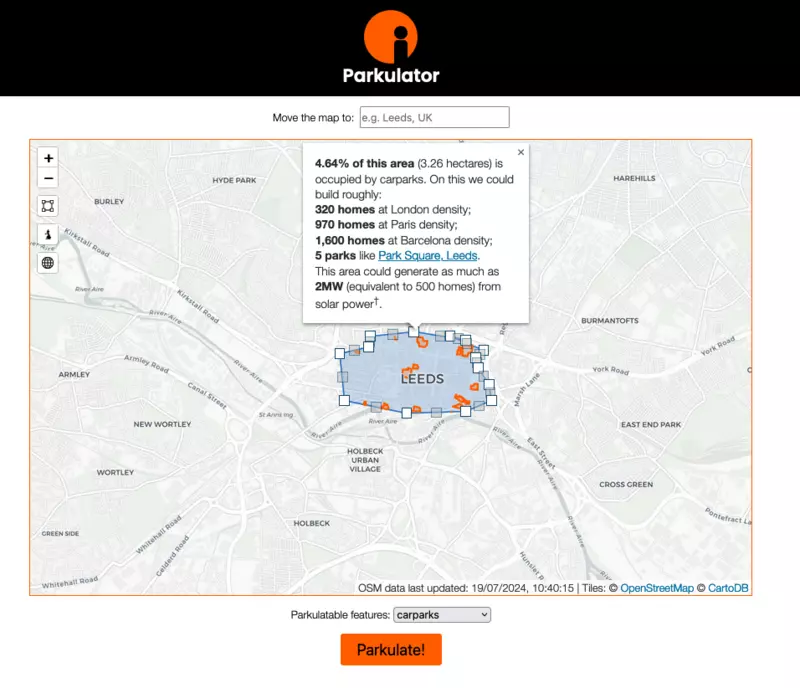
The Parkulator estimates how much land in a given area is used by car parks, and how many homes you could build there!
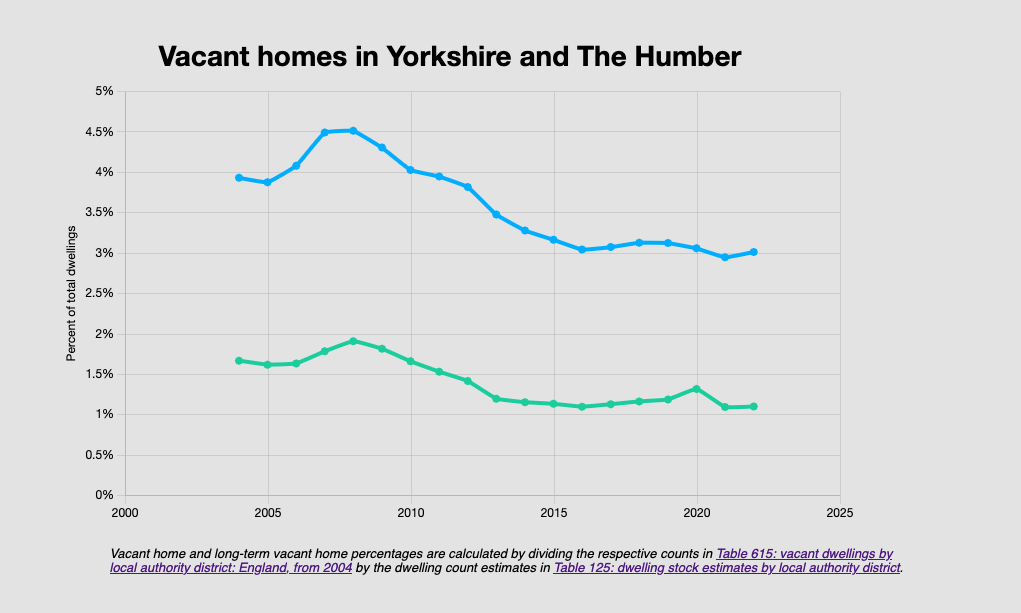
Credit: Open Innovations - Vacant Homes – a tool to visualise the percentage of homes that are vacant, by local authority
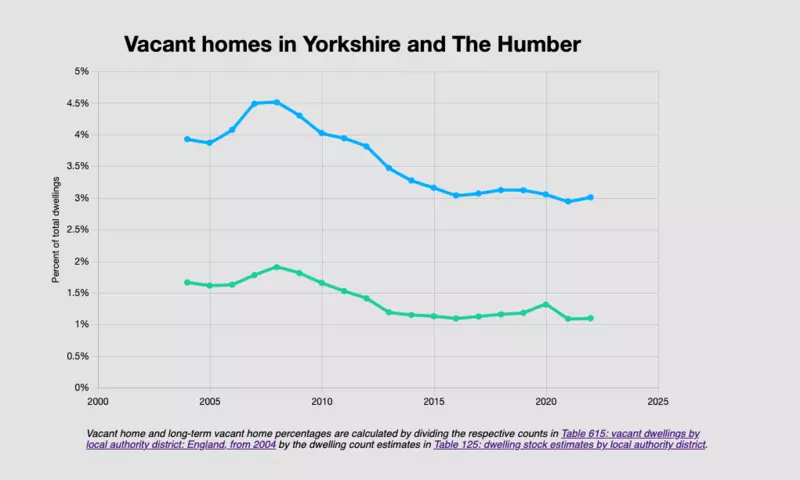
Vacant homes in Yorkshire and the Humber, with long-term vacant in green and all vacant housing in blue.
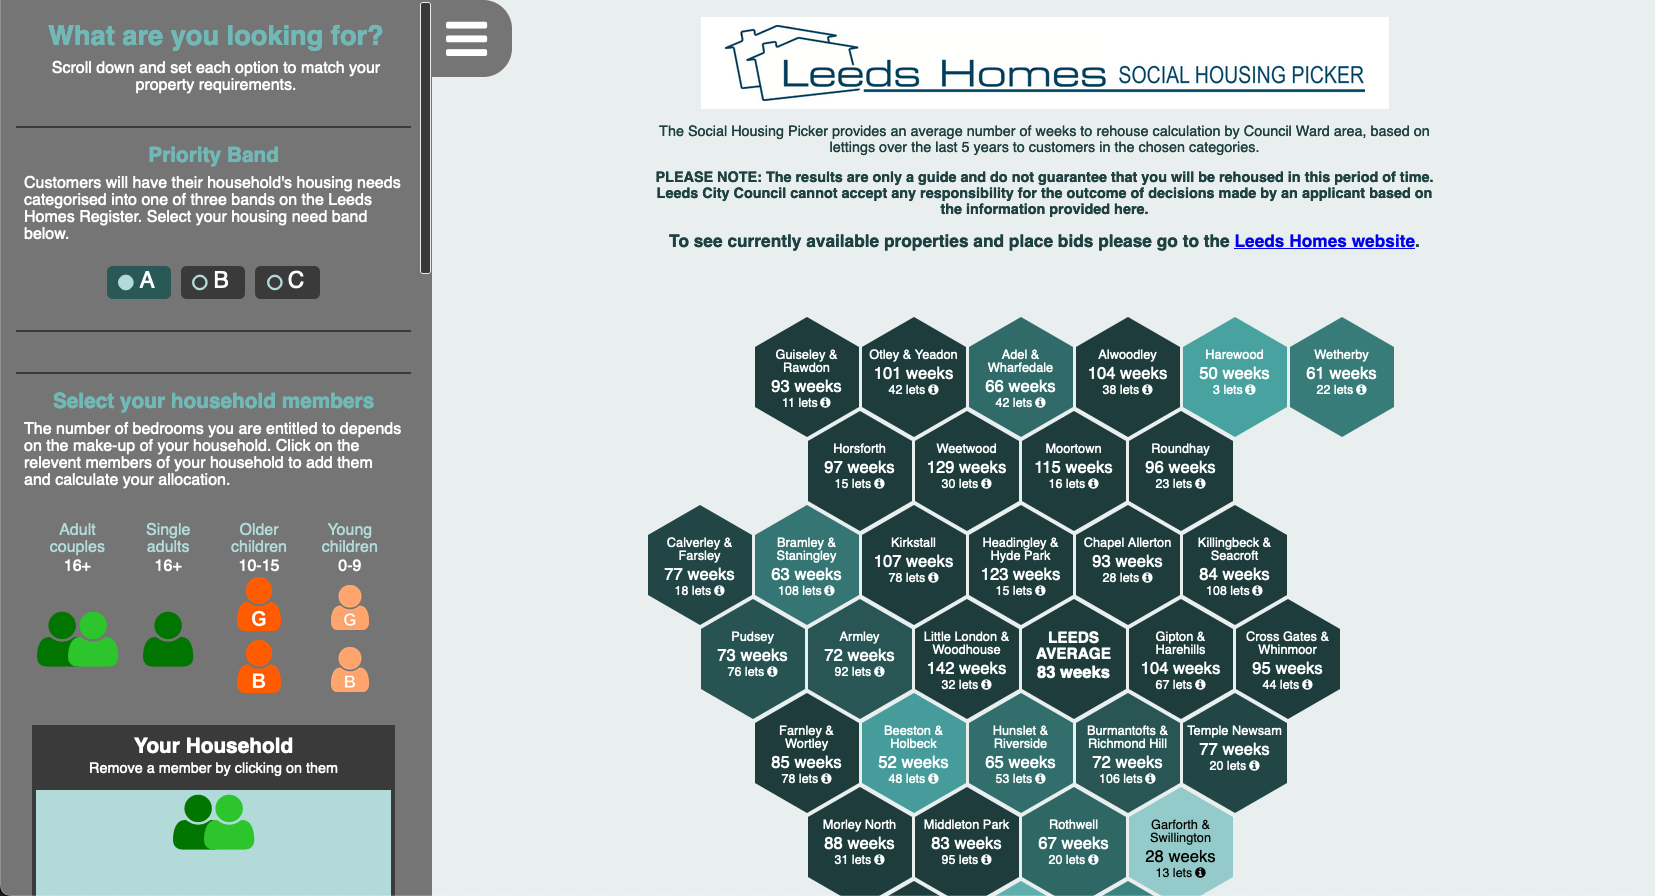
Credit: Open Innovations - Social Housing Picker – calculates an average number of weeks to rehouse by Council Ward area in Leeds, based on lettings over the last 5 years to customers in the chosen categories.
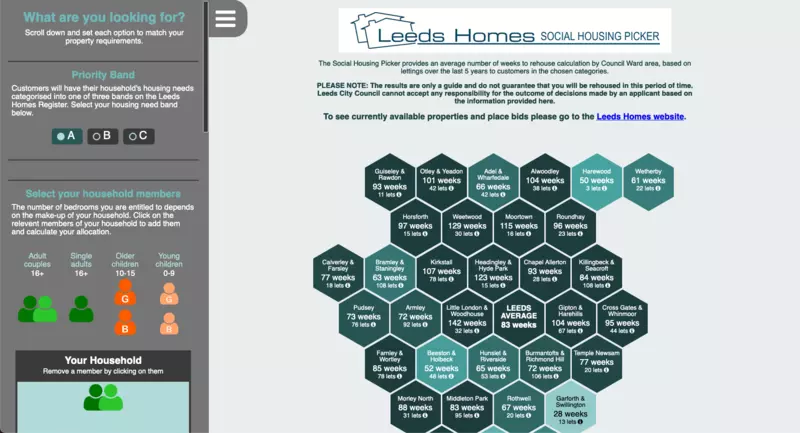
An example of using the Social Housing Picker tool.
Credit: Imactivate - House Prices Hex Map – constituency level data of house prices since 1995, and also house price to wage ratio
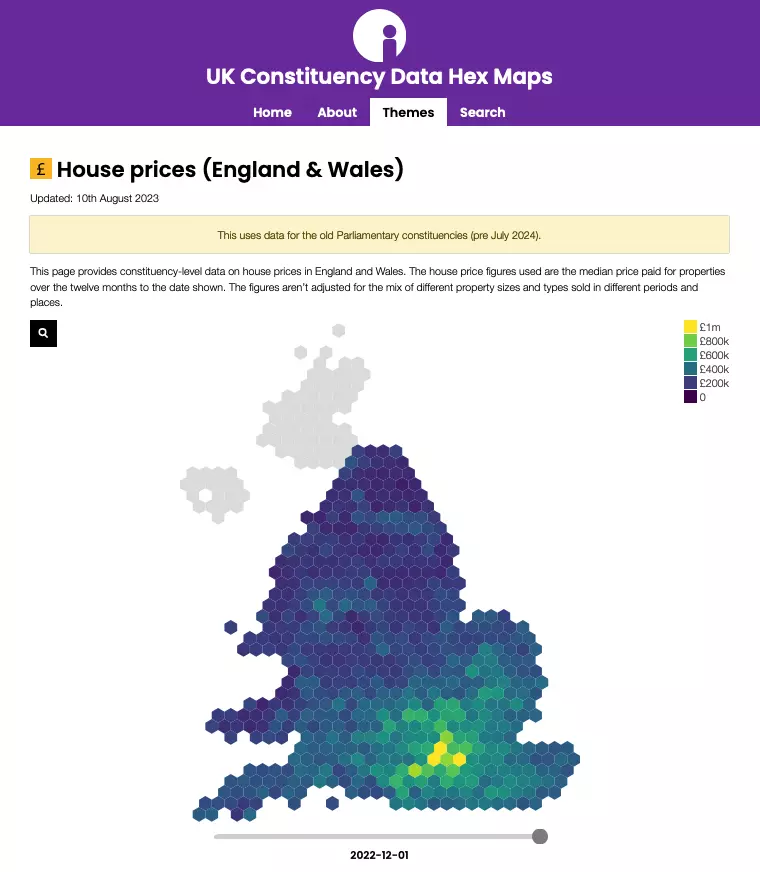
House prices in England & Wales on a hex map with pre July 2024 parliamentary constituency layout.
Credit: Open Innovations

Blogs:
- Building a Housing Tool – in addition to the tool itself, this project was useful for several reasons. The underlying architecture could be used for other planning tools. It highlighted the need for improving education and understanding about data licensing and good metadata. It. also showed that we need more data to be available openly to remove barriers, both in terms of accessing data and sharing data.
- The Housing Debate – a blog from last year highlighting Tom's and our views on housing and the related issues of transport and inequality.
What's Next?
Firstly, we want to update our existing tools with the most recent data available, starting with the empty homes tool. The main goal of this project, though, is to create new tools and visualisations. Here are some of our initial ideas:
- Hex maps – unsurprisingly, we think that Hex maps could be a great way to visualise different aspects of housing. We already have a few examples on our constituency site.
- Brownfield Hex map – using data on brownfield land, we could create a hex map that displays how much capacity there is for new homes at a constituency level. From a data perspective, we may be able to say what we think about the likelihood of targets being met, as the recently elected Labour Government have a "brownfield first" policy.
- Elections and Housing – using data from the 2024 general election to display voting behaviour by housing tenure type.
- Comparing houses built to the housing targets set by Governments in the past and into the future.
- Ranking the UK against Europe and the rest of the world on different metrics, e.g. vacant homes and housing density.
A New Home (ha-ha)
Of course, we need a place for all this new work to live. So, we created a new site called the Housing Data Explorer. This site will focus on new work that we do. We have also created a World of Housing page on the Open Innovations website, inspired by the World of Economics. This hub page will link to everything housing, both new and old.
This is just the start of what we want to do. As we progress through the project, we're sure that more ideas will be borne out of what we find. As always, we welcome your suggestions. Get in touch at hello@open-innovations.org.
We can spend time on our mission led projects like this due to the support of our sponsors who help to fund our #RadicallyOpen work - a big thanks to all of them.