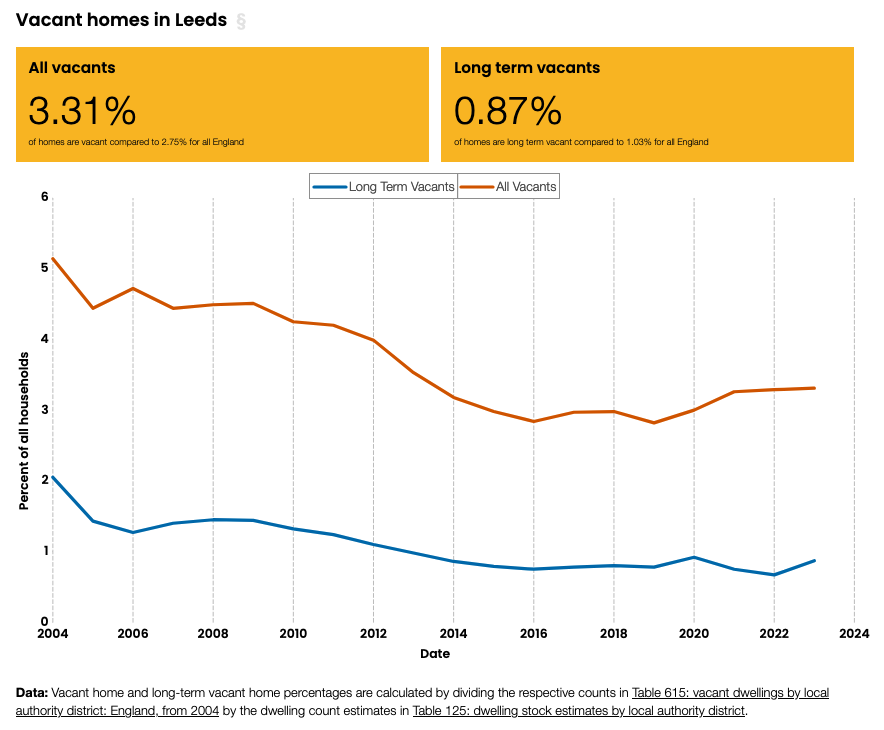
At the end of July, James and I co-wrote a blog about our new project: The World of Housing. We talked about why we are doing this, what we’ve done before, and what new things we want to do. The first thing we did was update the Vacant homes tool that Tom and Dan built a couple of years ago. Updating the data was relatively straightforward, given a consistent published format from the Ministry of Housing, Communities and Local Government. However, the updated data broke the tool. Some places were showing incomplete data or “NaN” (not a number), even though we could see that the data was present in the data files. We think that changes to geography at local authority level caused this tool to break.
There were several good reasons to make a new site over trying to fix that tool to work with the latest data. Firstly, the code was written several years ago, and I am not an expert in JavaScript. It’s also a dynamic website, meaning that it won’t display anything if you don’t have working JavaScript. Similarly, our technology stack has changed significantly since that tool was built. We now tend to make static websites using Lume, and we have a standardised visualisation library, OI Lume Viz. The net result was that we decided to make a new dedicated housing site, that would host the vacant homes visualisations and any new work we did.
Where we're up to
Over August, with other projects on pause for the summer holidays, we’ve had time to focus on building the new Housing Data Explorer. With the Vacant homes data cleaned and structured, the next thing to do was construct the architecture of the site. There was one key difference, however. In the old site, you could load and populate the charts for different areas on demand, on a single page. Lume though, is a static site generator, meaning that all the pages need to be loaded in advance, and served to the user as static HTML files. This equates to having a page per place in the data, rather than one page that you can reload with new data.
Vacant homes data is available at local authority level and above. That includes metropolitan counties, combined authorities, counties, regions and nations. In total, that would mean creating around 400 pages. Clearly, this was unfeasible to do by hand. Instead, building on previous work with the Joseph Rowntree Foundation and the GE2024 website, we’ve used page generators and an instance of DuckDB for Lume (lume-duck) to dynamically create and populate the static pages. The advantage of using DuckDB to manage the data on each page is that it only loads into memory what that specific page needs, and no more. For example, when generating a page for Leeds, a SQL query is executed to get data on vacant homes for Leeds only. This drastically reduces build time, which in turn allows for the generation of much larger sites.
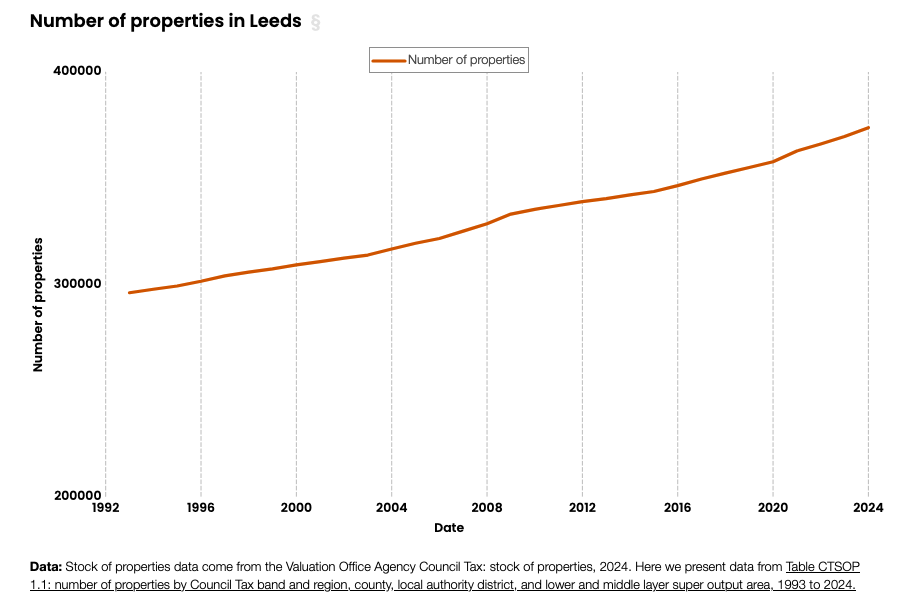
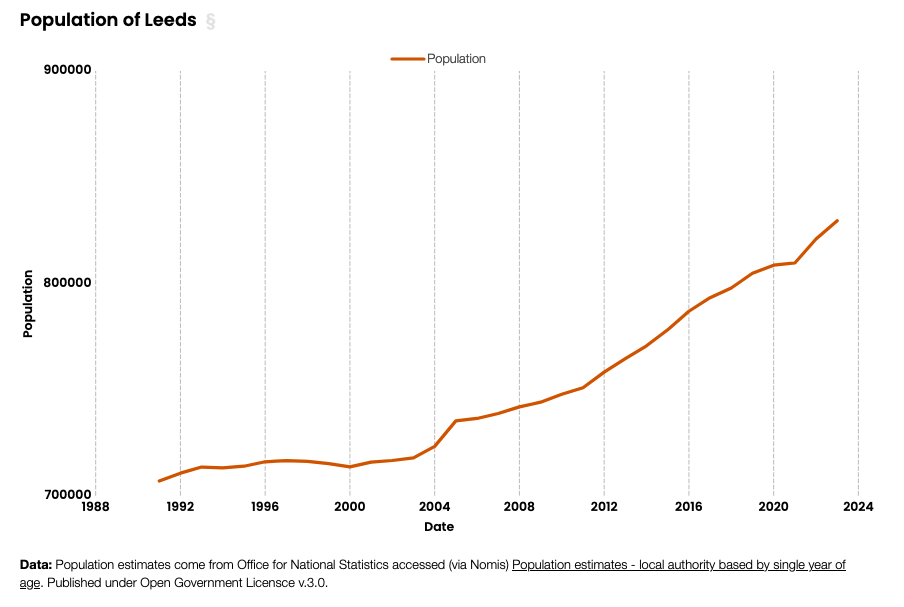
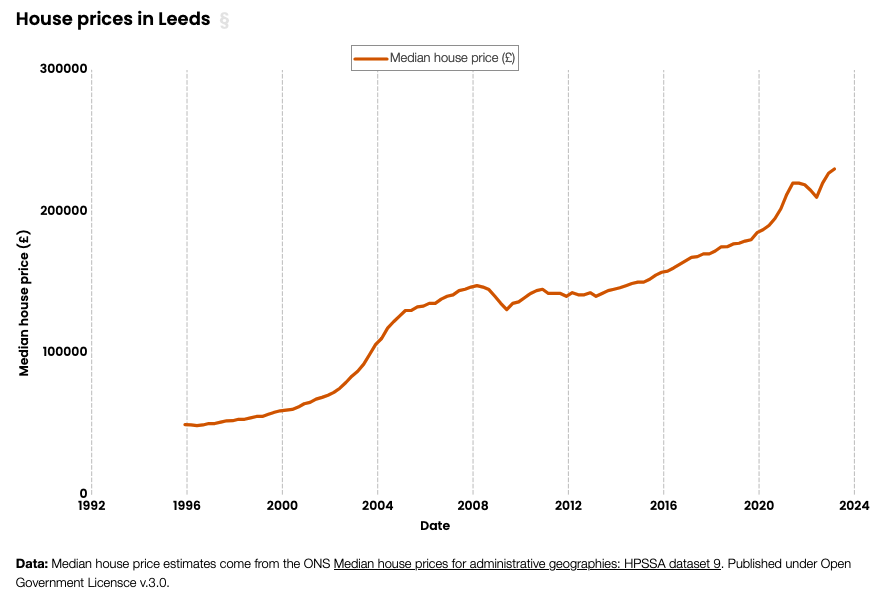
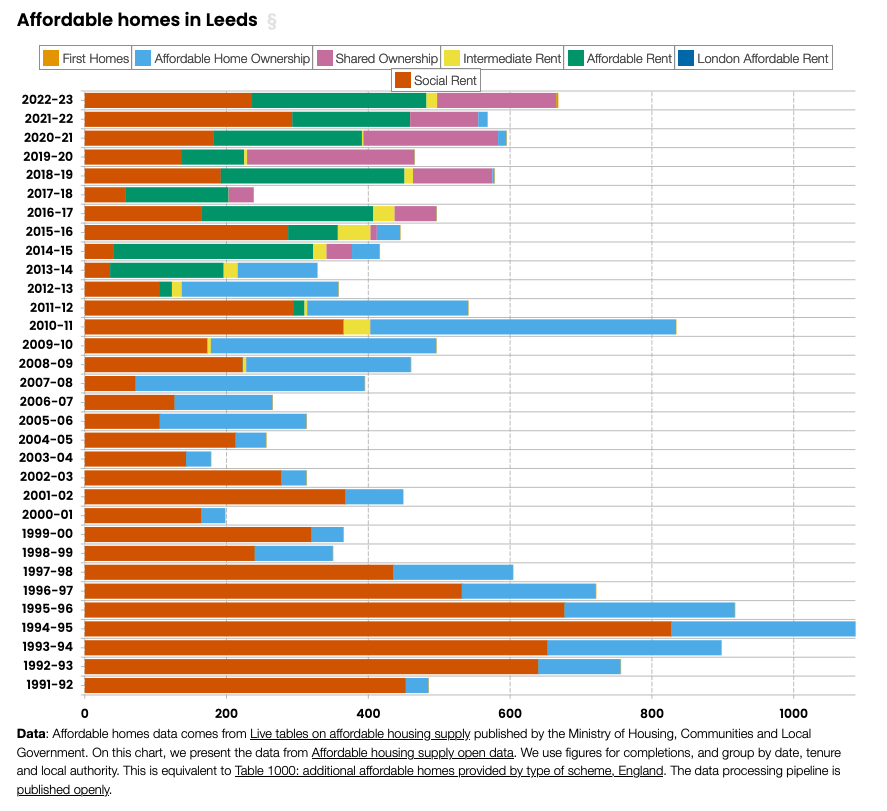
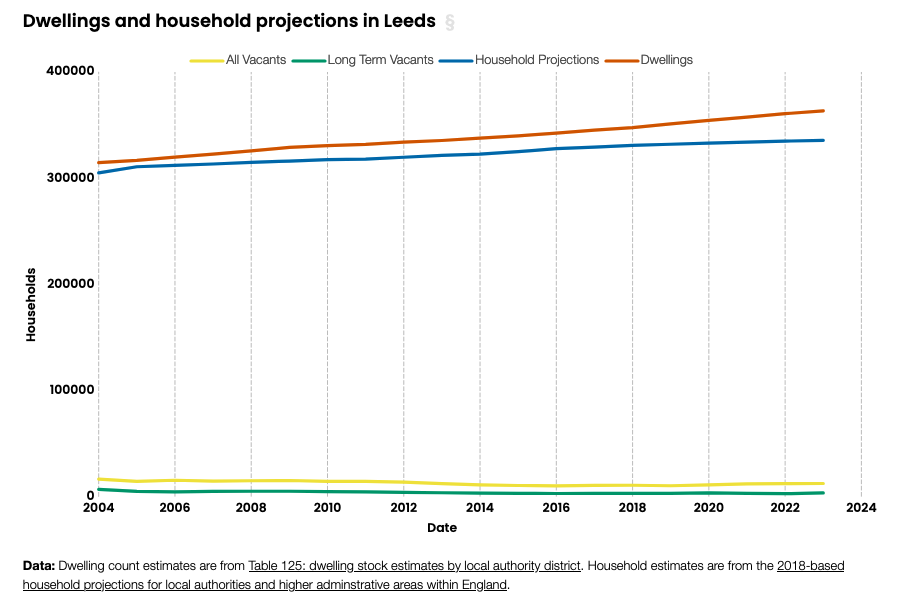
Over the last 3 weeks, we’ve added more datasets – we’re now up to six with data on Vacant homes, Dwellings and household projections, Affordable homes, House prices, Population, and Council tax stock of property. Each dataset is split by administrative areas of the UK, with the smallest type being local authorities, and the largest for the whole of England.
You can see visualisations like these on all local authorities, metropolitan counties, combined authorities and regions in England on the Housing Data Explorer.
Making it useful
In our experience from working with our sponsors and clients, whilst the national pictures on different issues are always important, local governments / councils / policy-makers want to know how their areas are doing in comparison to the rest of the country. This is often the only way they can make a case for change and, ultimately, secure funding. The site is built with this in mind. The consistent layout between places and summary statistics allow for easy comparisons. We want the site to be a tool that people can use to make data-led decisions.
This is only the beginning
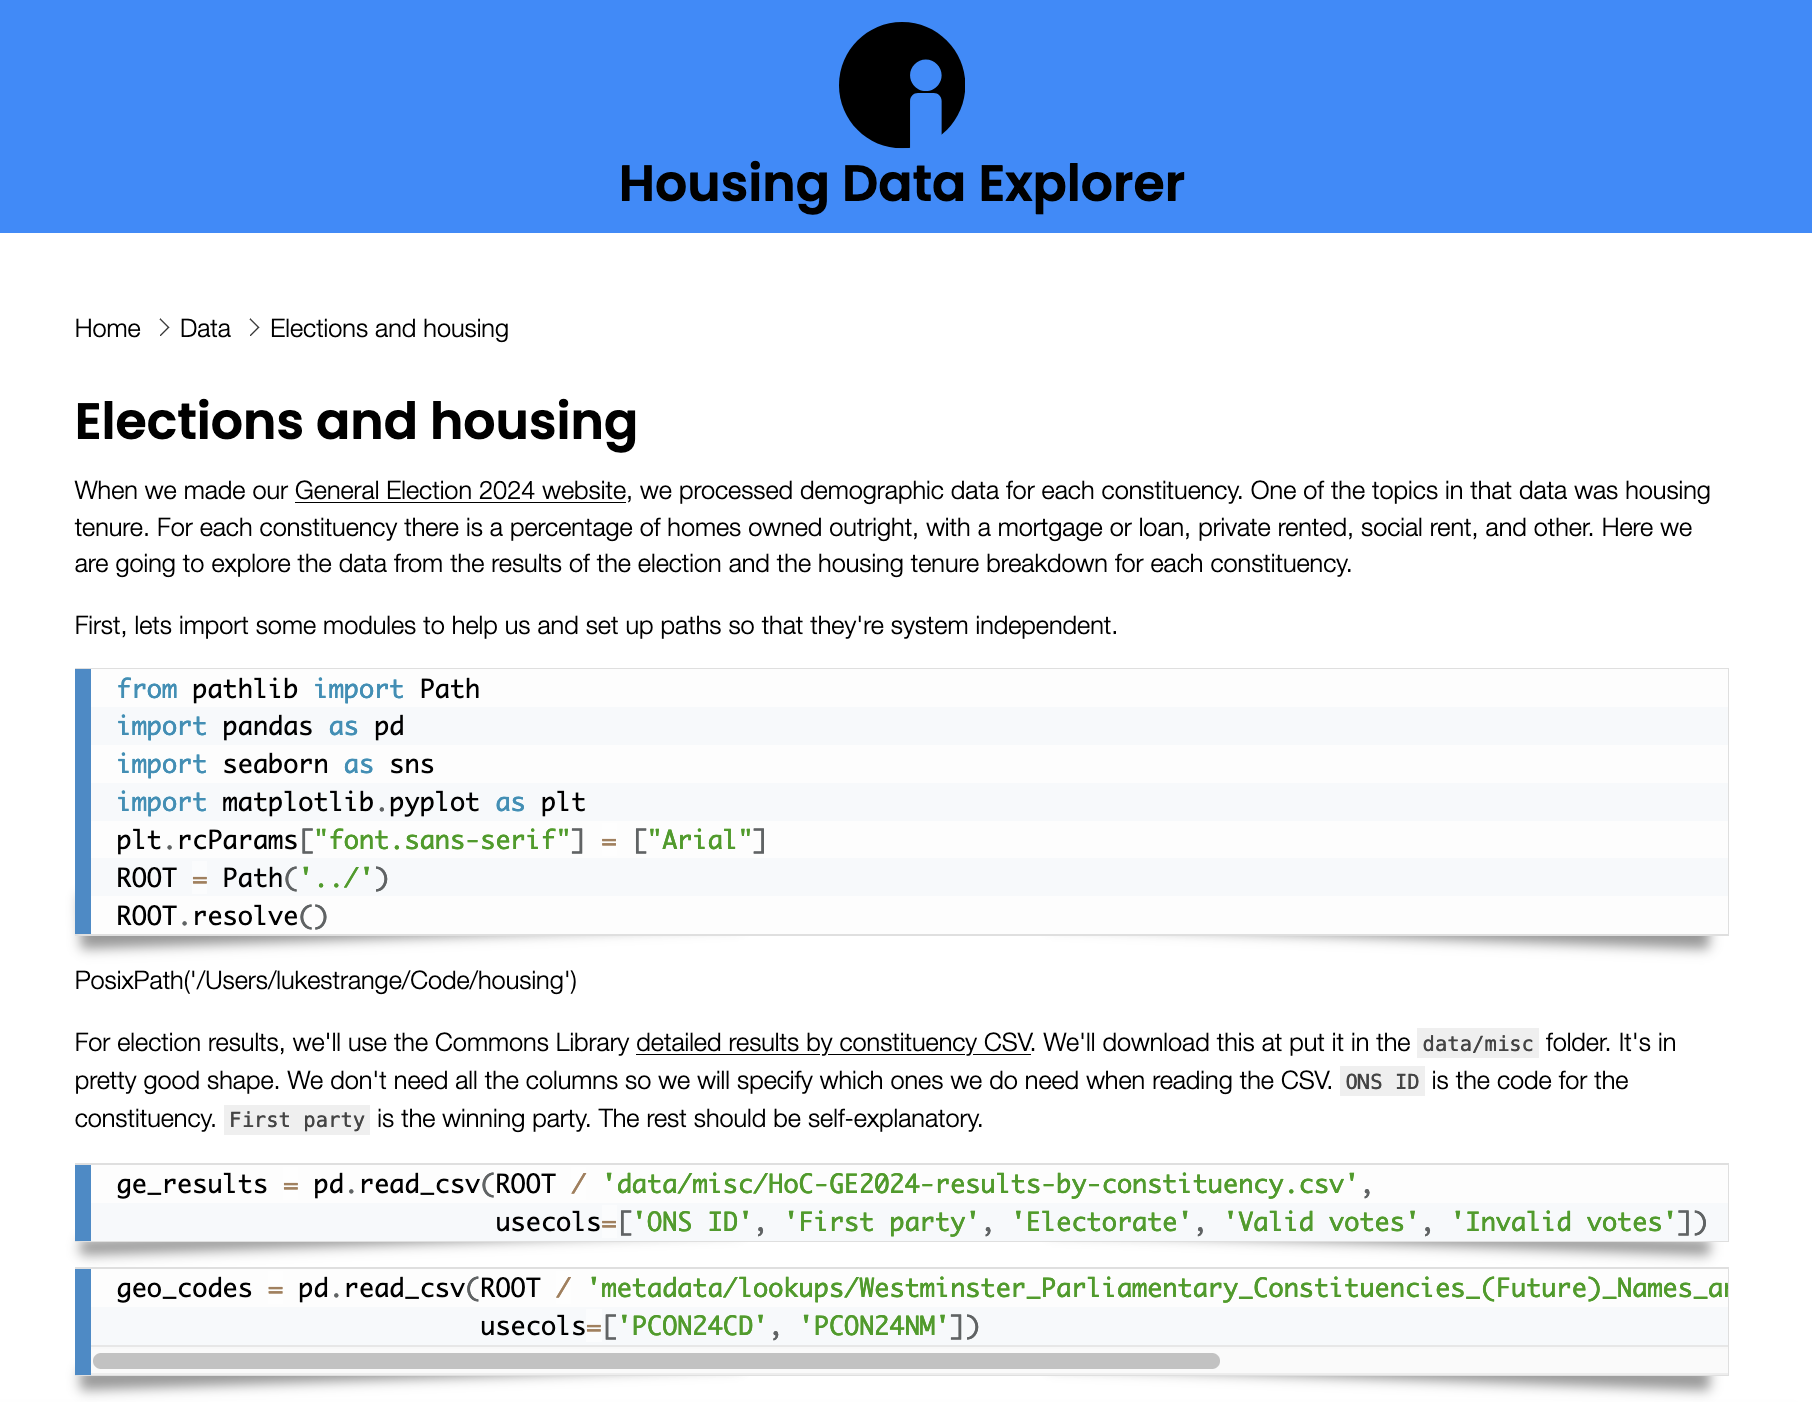
We now have a good base from which to explore some interesting ideas. The first few explorations are the relationship between elections and housing data, and affordability of housing. We’re testing out something new where we document the code in parallel to the discussion on the website. Technical-minded people may find this particularly interesting, but even if you don’t know any code, you can follow along by reading the descriptions.
Trying out documenting our code in parallel to data analysis. Credit: Open Innovations
UK Geography
It is so fragile. Regular updates to UK geographies create confusion and inconsistent datasets. It’s rarely stated which year’s geography codes a dataset is using. We’ve found datasets that use codes that changed more than 10 years ago. Not all datasets are published at the same geography levels, or with the same year’s codes/boundaries used. Depending on when in the year a dataset is published, it may lag behind the current geography codes. We’ve learnt never to trust names because they’re extremely inconsistent. For example, “St. Helens” and “St Helens” or “City of Bristol”, “Bristol” and “Bristol, City of”.
We regularly use and appreciate the Open Geography Portal. Yet we often find ourselves hand-curating lookup tables to fix things, either because we don’t have codes or because people have used incorrect/older codes in various datasets. Anyone who has worked with UK geographical data will understand our frustrations. More recently, the same issues have been cropping up time and time again.
One thing that would help is an open database of all the different geography codes, their predecessors/successors and the official name of the place. FindThatPostcode does an excellent job at this, but since it’s maintained by just one person, it would be unreasonable to expect this to be completely up-to-date.
After a discussion about this with a few of the team, we recently discovered the Code History Database for the UK. This is something close to what we need. Since then, we’ve been building a geography-code-adder: a tool to add geography codes to CSV files with geography names only. It runs off simple JSON files split by the first three characters, e.g. E08. In each JSON, there is an object for each code containing information about that code. These will be useful across many of our projects, and will be fairly easy to update as long as the database format doesn’t change. You can read more about it in a blog Stuart wrote. We’ve also been discussing a flow-chart that would help you work out which year’s codes a dataset is using. Let us know if that is something you would find useful.
Another challenge is that data for Wales, Scotland and Northern Ireland is often published independently and/or in a different format. It varies significantly for each dataset. For this reason, the site only currently covers England.
Optimising the site
Many aspects of the site have been optimised to reduce memory usage when building the site. For example, we’ve switched to parquet files to store the data that the site queries. Unlike a CSV, a parquet file can skip rows it doesn’t need to use based on the query. Whilst the savings are small per query, across 6 datasets and over 400 pages, this results in several seconds reduced build time. Similarly, we think that masking data from other pages speeds up the build by quite a bit. For example, we have a large JSON file with an object for each page we want to generate. But each page only needs to know about the current object, not the entire JSON file. We’re yet to benchmark it, but we think this reduces the build time of our sites significantly.
Another useful feature we implemented is the ability to locally host a smaller version of the site while working on changes. The full site takes ~25s to build, which is pretty quick considering the number of pages. But if you want to make small changes that you aren’t 100% sure will work, you don’t want to wait 20–30 seconds each time to find out. To solve this we wrote a small TypeScript function that, when you serve a development site locally, it takes a subset of the JSON file that is used to generate the pages. By default, it picks the first 10 areas, but you can specify how many you want.
A slimmed down version of the site can be built in ~1s, perfect for trying new features.
Across the site, we use progressive enhancement (JavaScript is only used to augment interactivity). For example, the Leeds page contains 6 (interactive) charts, and is only 317kB (57kB compressed). This saves the visitor bandwidth (and CO2 emissions) and makes the page very performant. It gets a score of 100 on PageSpeed Insights.
Development Bugs
A small but irritating bug is that lume-duck seems to convert null values to 0. This was a problem on our line charts where we had multiple series, with some years missing data. In this case, the lines would plunge to 0, which is both incorrect and misleading. OI Lume viz is built to handle null values in data, so we have come up with a temporary fix whilst we diagnose the issue. This is an example of how new technologies can break things that weren’t broken. However, we wouldn’t have got to this point without lume-duck, and we are confident we will find a fix sooner rather than later.
We want your help!
Now that we have something up and running, we want you to use it and let us know what you want to see on the site. We welcome any improvements you can think of, both in terms of data and usability. We also want your feedback on our data explorations. How can we improve them or do some new analysis you haven’t seen before. We welcome your suggestions. Get in touch at hello@open-innovations.org.
We can spend time on our mission led projects like this due to the support of our sponsors who help to fund our #RadicallyOpen work - a big thanks to all of them.
'%3E%3C/circle%3E%3C/g%3E%3C/svg%3E)