'%3E%3C/circle%3E%3C/g%3E%3C/svg%3E)
Transport accessibility in 2024 – How did we get here?
2017
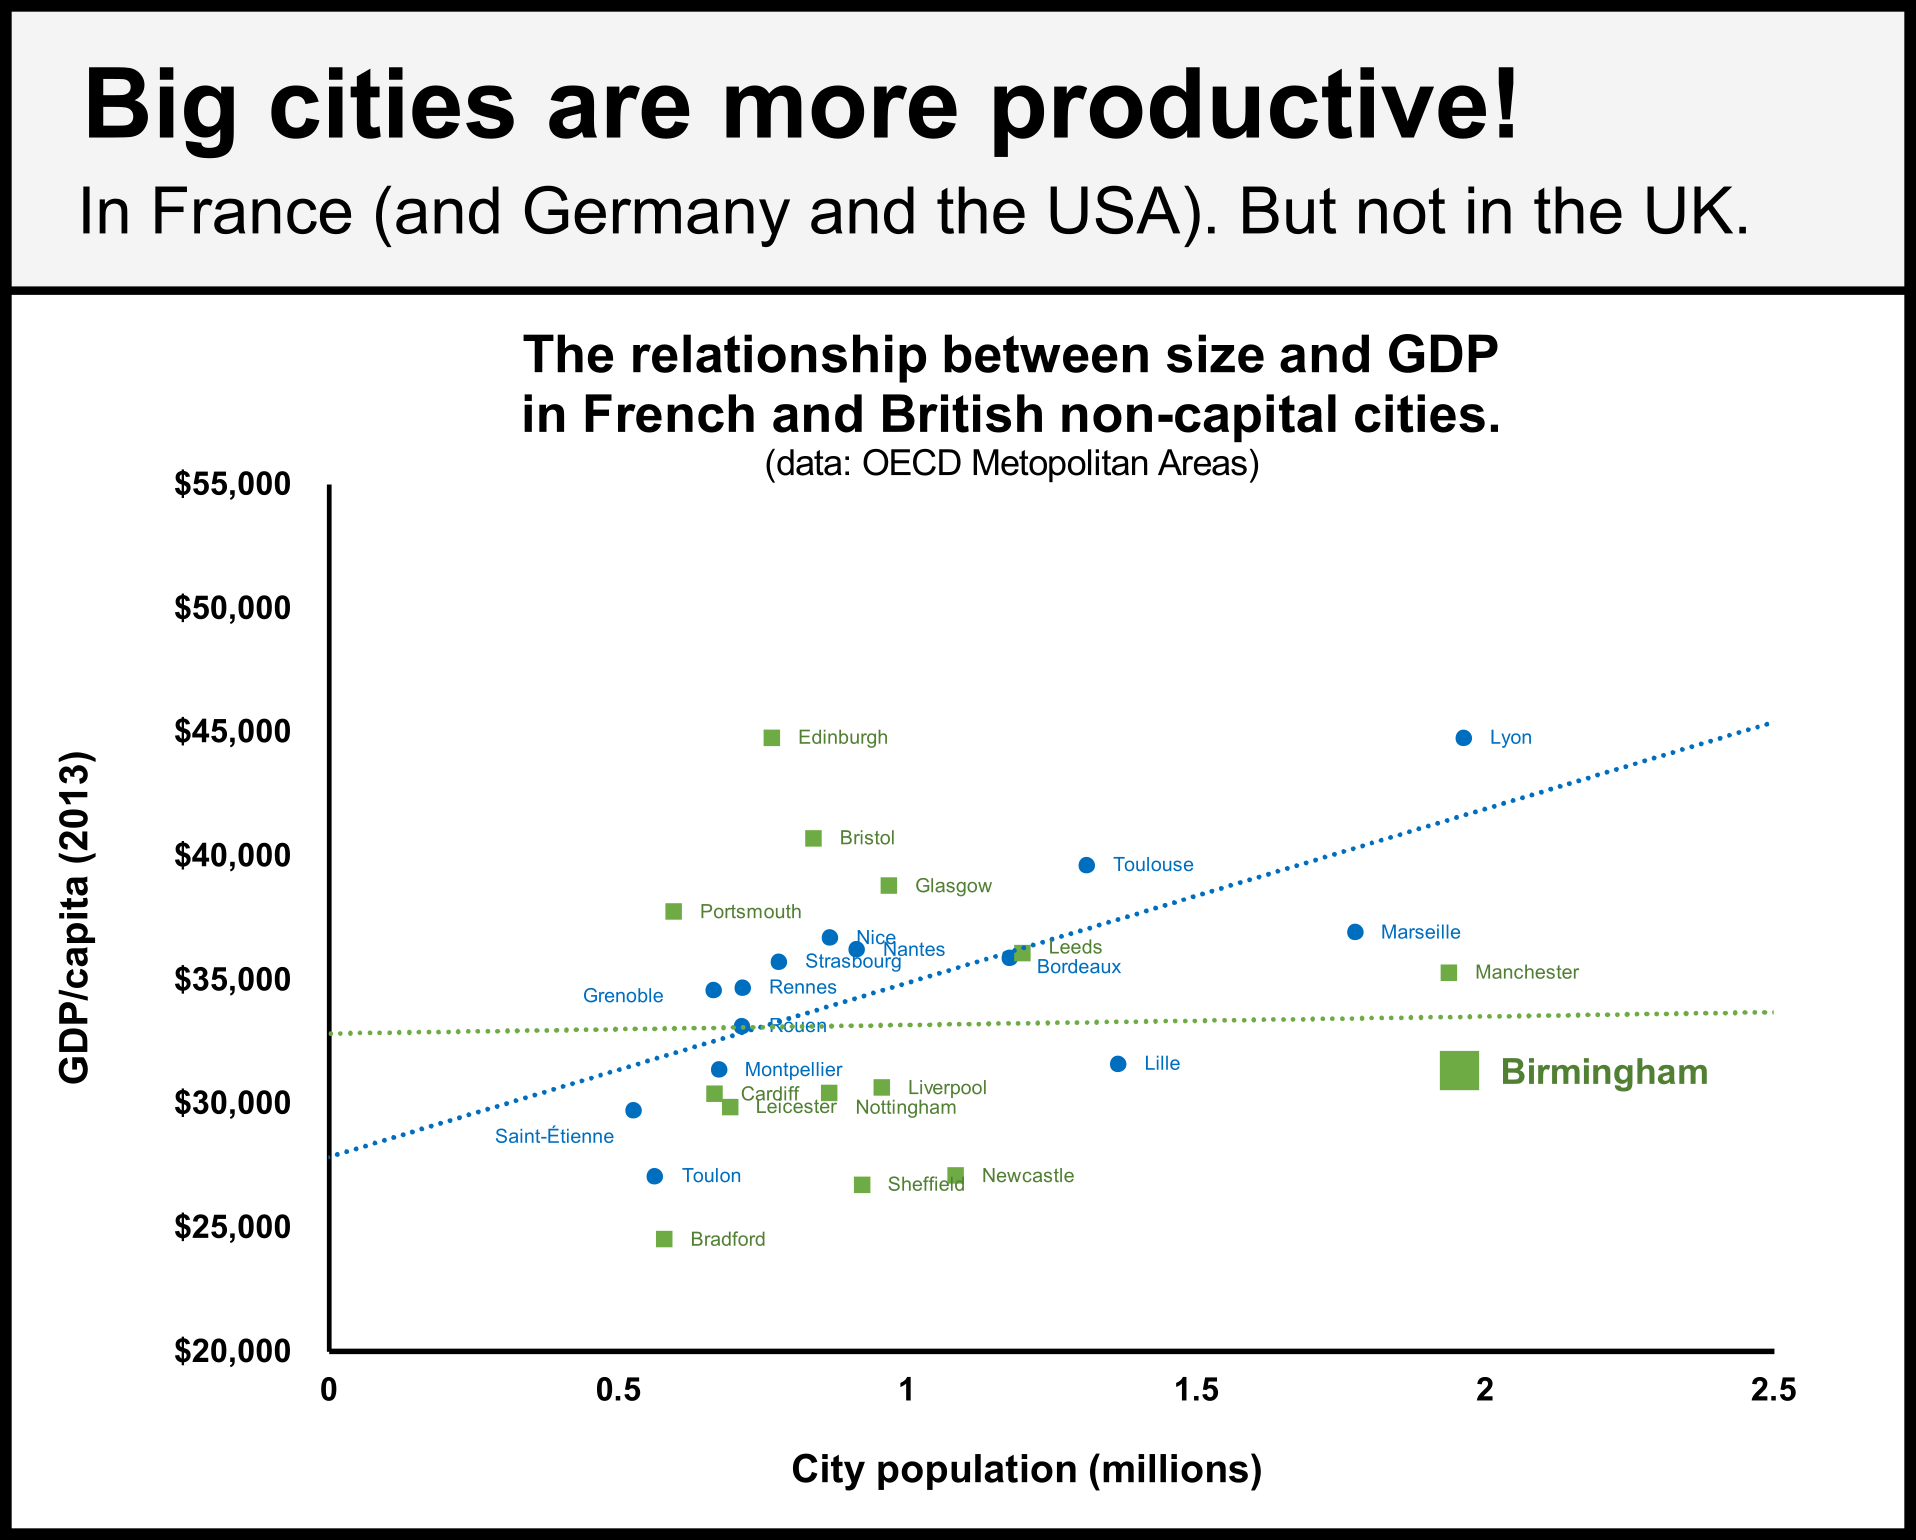
In 2017, Tom Forth, working with ODI Leeds and Open Transport North, started tracking every bus in Birmingham for a year. They tracked the buses in real time; around 40 million departures and 16GB of data as of January 2019. They then published a blog titled “Birmingham is a small city”. The reason behind that work was this chart:
Credit: Tom Forth
Many economists argue that cities become more productive as they grow in size, because of something called agglomeration benefits. In many developed countries such as the USA, France and Germany, this pattern is observed. However, somewhat uniquely among large developed countries, the UK breaks this trend. The UK’s large cities see no significant benefit to productivity from size, especially when we exclude the capital.
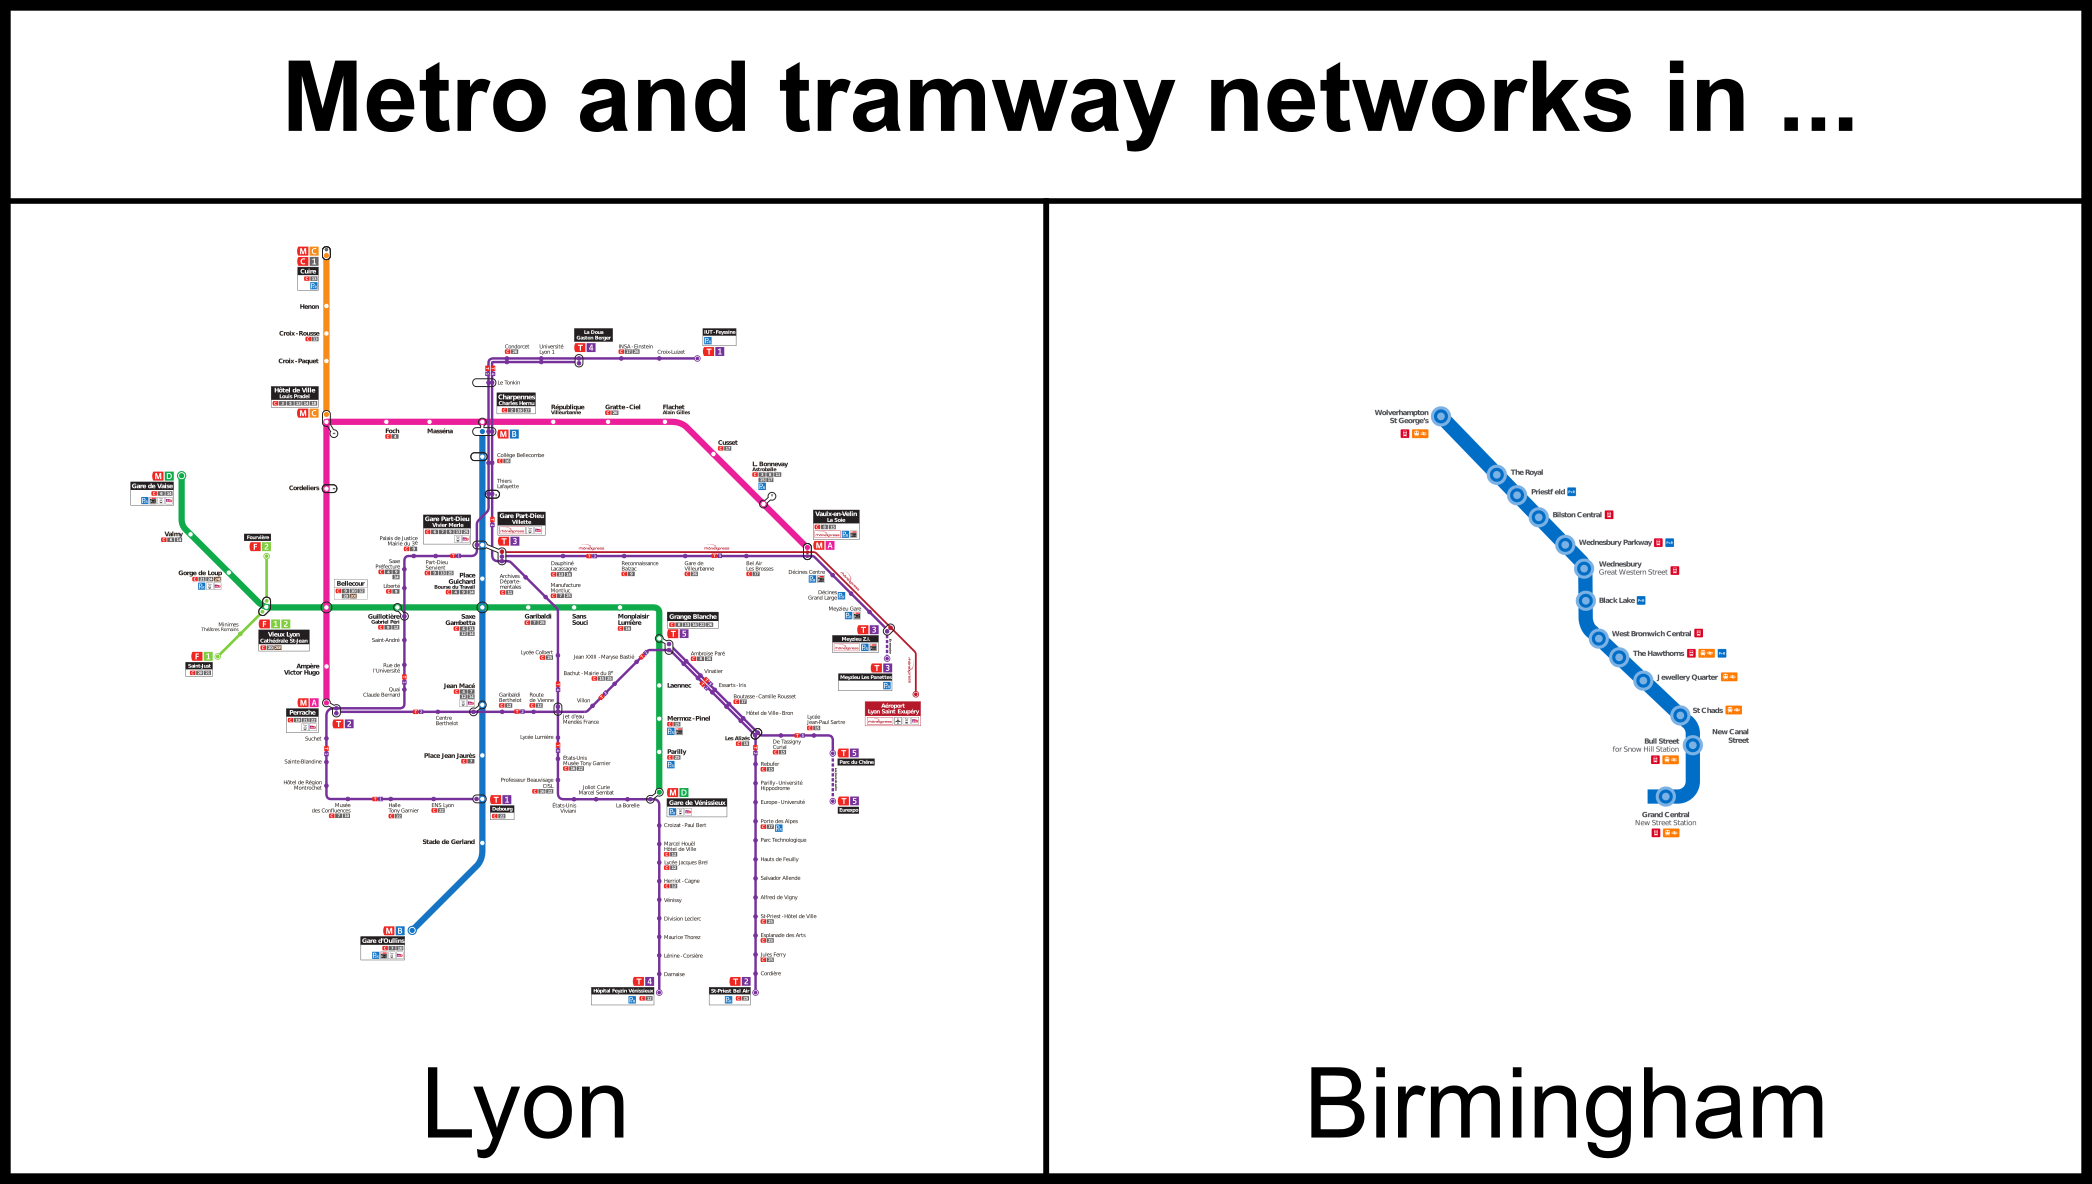
In that blog, Tom went on to explain that a significant difference between the UK’s large, non-capital cities and other countries is the lack of public transport infrastructure. This is something we are acutely aware of in Leeds. If I had a penny for every time I’d heard someone say “You know, Leeds is the largest city in Europe without a metro”...
Credit: Tom Forth
So, we posed the question: Is it possible that poor public transport in the UK’s large cities makes their effective size smaller, and thus sacrifices the agglomeration benefits we would expect from their population?
Our Real Journey Time data lets us ask this question. At this point, we would recommend reading Tom’s original blog post to fully understand the analysis.
In summary, the key findings were:
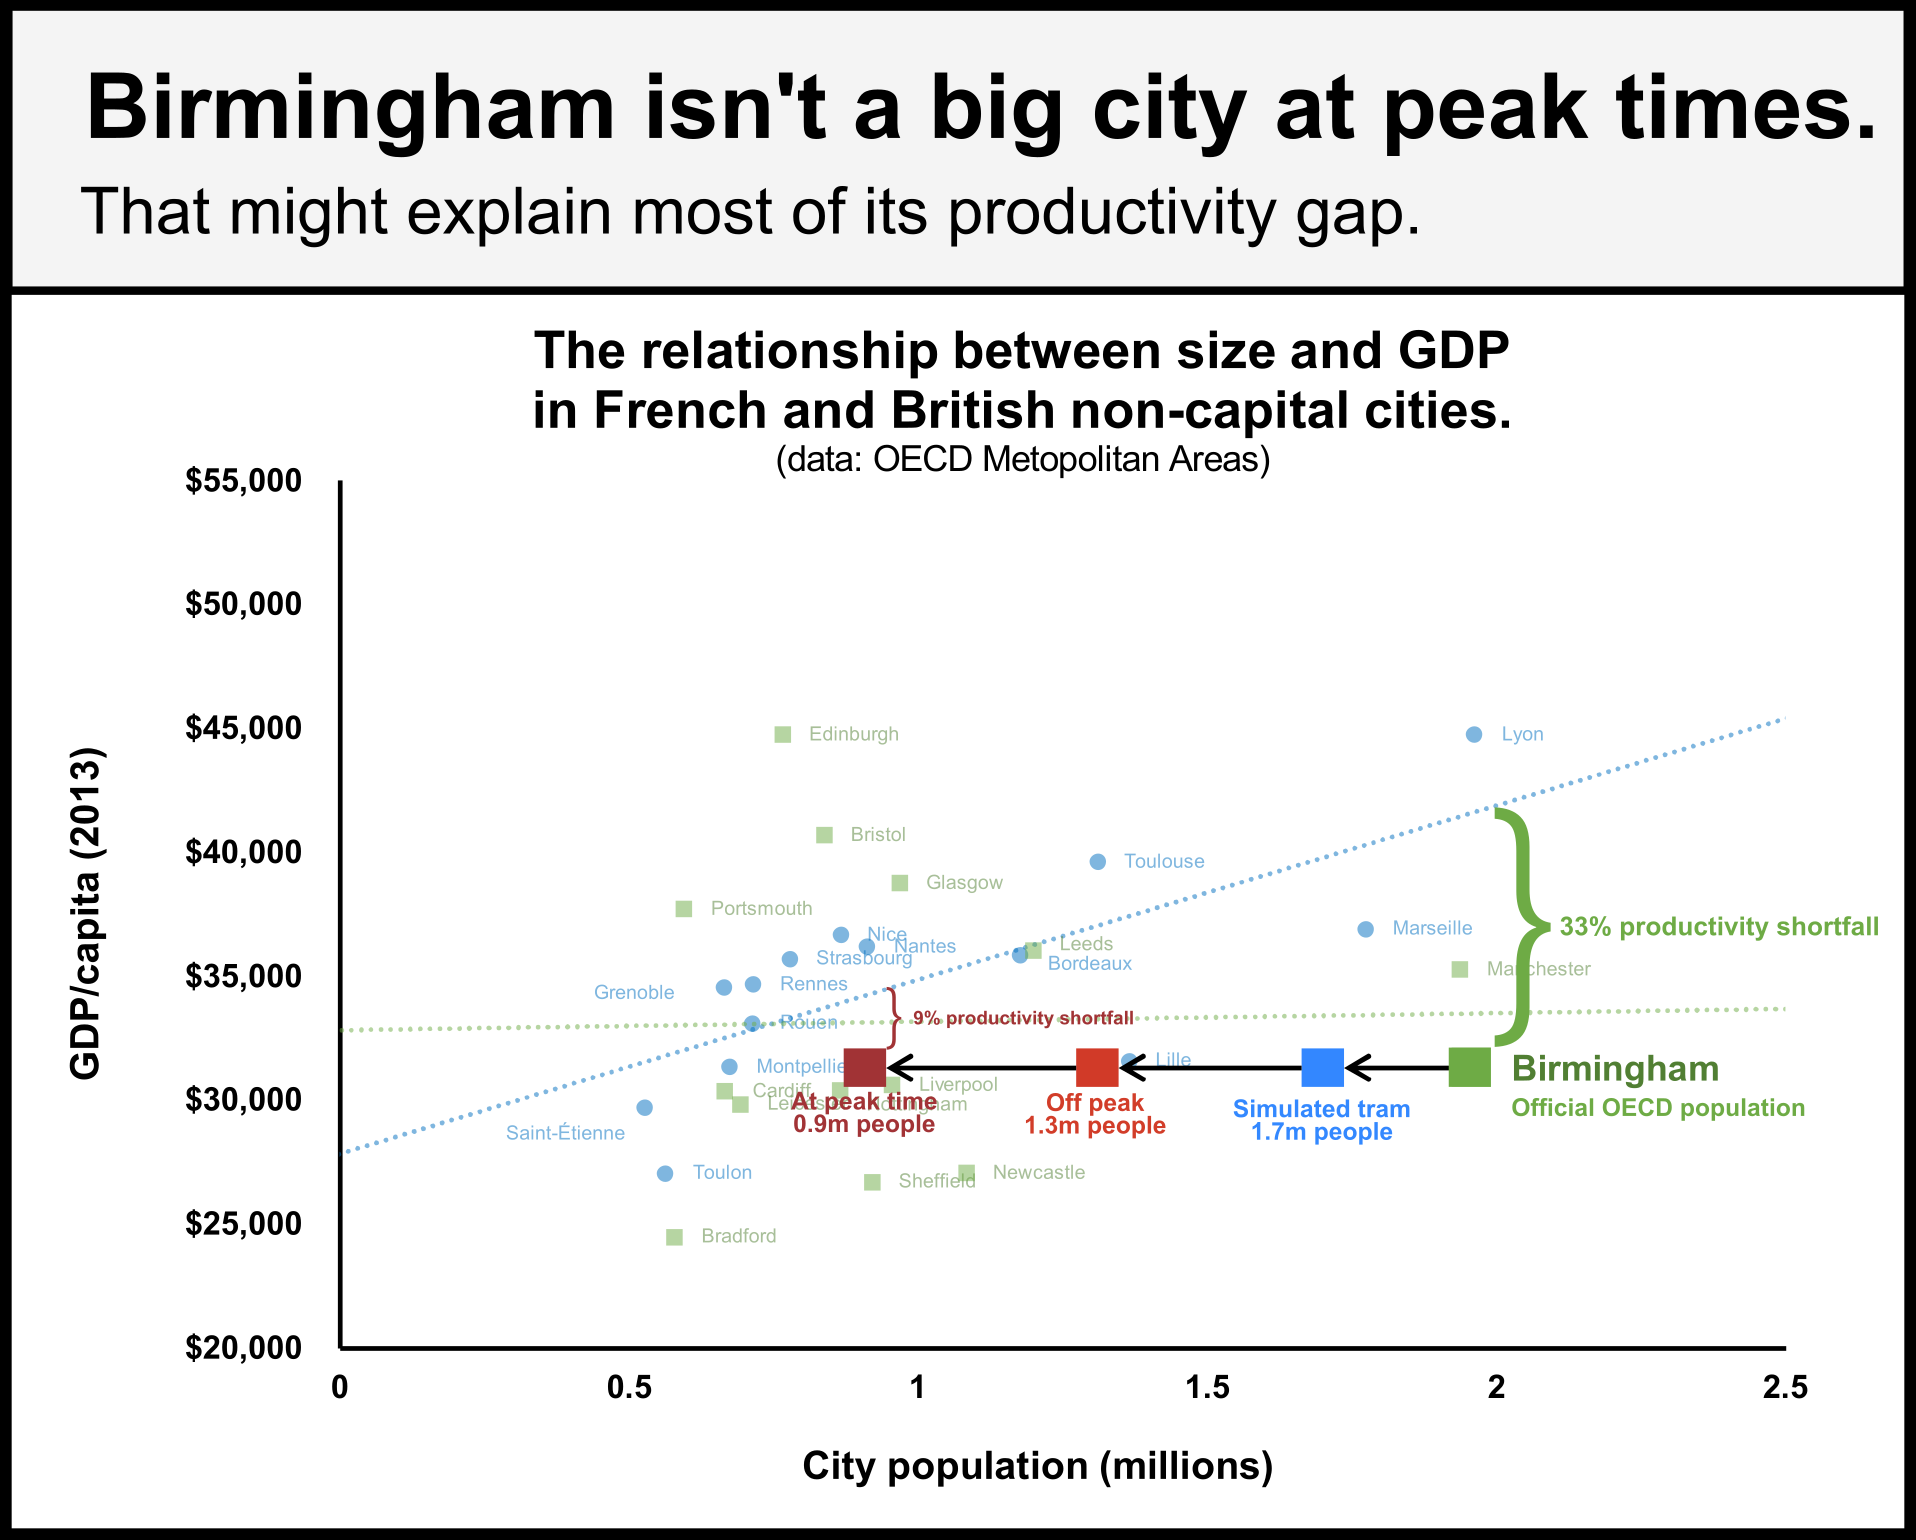
- If we consider that Birmingham has a population of 1.9 million, and we assume that agglomeration benefits should work in the UK to the same extent that they work in France, Birmingham has a 33% productivity shortfall.
- At peak time (8am-9am) Birmingham’s effective population is just 0.9m, less than half the population that the OECD use.
- With an effective population of below 1 million people at peak time, the productivity shortfall reduces to just 9% and is no longer significant.
Credit: Tom Forth
2023
Fast-forward to 2023. We published more work about transport accessibility. In short, improvements to Open Trip Planner and QGIS, the creation of the Bus Open Data Service, the adoption of General Transit Feed Specification (GTFS), and more powerful computers becoming affordable enabled us to repeat some of the analysis we did for Birmingham at the national level. We calculated travel time isochrones for various UK cities, including Leeds and Bristol.

Credit: Thomas Forth
We see clearly that in reality the accessibility of Leeds by bus is nowhere near that suggested by the timetable. In addition, using our population calculator tool, we found that the population within 45 minutes of central Leeds by bus on a typical December late afternoon is:
- 445 thousand according to the bus timetable.
- 165 thousand according to the buses that ran and the speed they ran at
This was an even larger reduction in effective size than our previous work for Birmingham. We suspected that this is because Leeds has no tram, our work did not consider trains, and because congestion was particularly bad on this day due to Christmas shopping and ongoing roadworks.
Despite the great work we had done, we knew we could improve it further. Switching to the GTFS-RT standard would help us to expand our work abroad (since it’s a global standard) and work with others to improve our processes more rapidly. We also wanted to include the real-time location of trains, trams and metros. Switching to GTFS-RT would also help us achieve this, since from a code perspective, it doesn’t matter which type of vehicle we’re trying to track. However, we couldn’t do the work for free, despite how much we love buses.
2024
Earlier this year we spoke to Liverpool City Region Combined Authority (LCRCA) who were interested in repeating our analysis for buses in Liverpool. We saw this as a great opportunity to update our methodology to address some of the challenges we’d faced before, in addition to completing the analysis for Liverpool City Region. It was also an opportunity to make something open source and standardised so we could work with other regions or nations in the future. In September, we agreed a new project, commissioned by LCRCA, to do exactly that.
So, for this project, we agreed to:
- Track all the buses in Liverpool City Region for 2 weeks.
- Update the existing code, previously written in C# and using Siri-VM location data, to Python and GTFS-RT location data from the Bus Open Data Service.
- Create accessibility isochrones for LCR and a web visualisation.
- Complete QA of the final output with LCRCA to validate the results using local knowledge.
- Publish technical blogs on our work.
Parts 1 and 2 are complete, and this blog is the first contribution to part 5. We’re working on parts 3 and 4 now. The code is published on the GitHub for this project. Note that we are still making small tweaks to our code as we debug with the real-time data.
We’re currently writing part 2 of this blog, which will be a technical blog explaining how we match the buses to the timetable to create a version of the timetable for buses that actually ran.
We are grateful to LCRCA for funding this project and giving us the opportunity to continue and improve this work. We are very excited to be updating the code to GTFS-RT and write it in Python, which will make our work more accessible.
Thanks for reading and stay tuned for part 2. In the meantime, please get in touch or visit our website.