'%3E%3C/circle%3E%3C/g%3E%3C/svg%3E)
Are council websites getting bigger?
Measuring Impact
This week, we were in touch with Mid-Suffolk District Council about reducing the size of their website. They responded by reducing their homepage from 25MB to 3.8MB, and told us that our homepage emissions website was:
very enlightening and has given me a further target to work towards for the Digital Transformation within the two councils I work for
The concept of Digital Transformation led me to think about what that might actually entail, and how a council might go about measuring whether any kind of digital transformation has been a success.
I therefore wondered how council website pages have changed over time, since we started tracking them, and whether we have made an overall impact on council homepage emissions.
Fortunately, we have the data to answer that question.
Council Websites are getting bigger
We went through the data we've collected to find council home pages that were from currently active councils.
We then grouped the data by date of measurement, only using dates when at least 10 council websites were measured. This was to cut out any days when we made a specific measurement of one (or a handful) of websites to see if they’d improved based on our feedback.
We used the median page size of websites on each date to reduce the effect of extreme outliers.
Lastly, we used page size rather than grams of CO2 because the methodology for estimating CO2 emissions changed over the time period of the data.
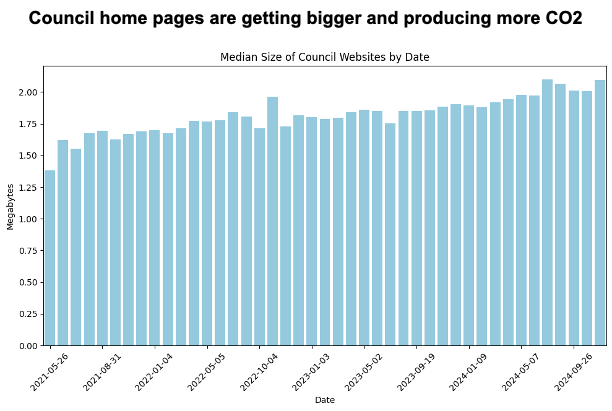
Unfortunately, despite our efforts, it is clear that council website homepages are getting larger. In fact, the median page size is now one and a half times larger than in 2021.
Why should we care?
Overall, councils are doing badly.

Credit: Open Innovations Council Homepage emissions
Council websites are not the only ones doing badly. This is a reflection of a general trend, that the internet and its web pages continue to grow. A large part of the reason why is down to improvements in technology. As computers become more powerful, internet speeds get faster, and internet accessibility improves, the average user can download more data more quickly. This has a knock-on effect on developers, who no longer need to care as much about optimising the size of their websites.
Even though we may now consume more content via the internet, pages have also become larger because there’s rarely a necessity for them to stay small. If I am developing a website on the latest MacBook Pro, and have 250Mb/s internet, I am not going to notice any lag while loading a 50MB website with excessive JavaScript running in the browser. It may not even occur to me that my website were excessively large or slow to load for some users.
That is why it’s important to remind people that websites are ultimately a source of carbon.
You may not think of websites as sources of carbon emissions but they are. Data centres, transmission networks, and the devices we use to access them all use electricity which, in turn, produces carbon emissions. When your website has lots of visitors that can easily add up.
For websites with lots of visitors, even small changes to the size of the website can have a big overall impact on the emissions associated with that site. A website that generates 1g of CO2 per visit, with 10,000 visitors a month, works out at as much CO2 as boiling water for 5,700 cups of tea a year.
A single visit to a 30MB homepage (12g of CO2) would use an entire day's worth of data for someone on a 1GB monthly plan. Should accessing local government be that much of a burden on the poorest in your community?
What can you do?
Conclusions