'%3E%3C/circle%3E%3C/g%3E%3C/svg%3E)
Culture Connect: A culture data observatory for the North East
For the last six months, we've been working with Northumbria University, the North East Combined Authority, and TPXimpact on a pilot project: an open-access data observatory that brings together cultural data from the Newcastle region.
As devolution shifts more decision-making power to local authorities, having solid local data infrastructure is crucial. It helps decision-making on funding, investment, addressing barriers to participation, and shaping policies that support the growth of the cultural sector. This infrastructure also ensures Newcastle's cultural heritage is preserved and adapts to changing trends in behaviour and engagement with arts and culture.
We haven't shared much about this project until now, so in this blog, we'll introduce the data observatory and discuss some of what we've learned.
The Culture Connect Data Observatory
You can check out the outputs here: Culture Connect Data Observatory.
Data landscape
Our first step was desk research to understand the culture data landscape - what data is already available, and where are the gaps?
We focused on funding and participation data for the Newcastle region, bringing together and visualising key datasets from various sources such as the North East Combined Authority, Department for Culture, Media and Sport (DCMS), Arts Council England and others.
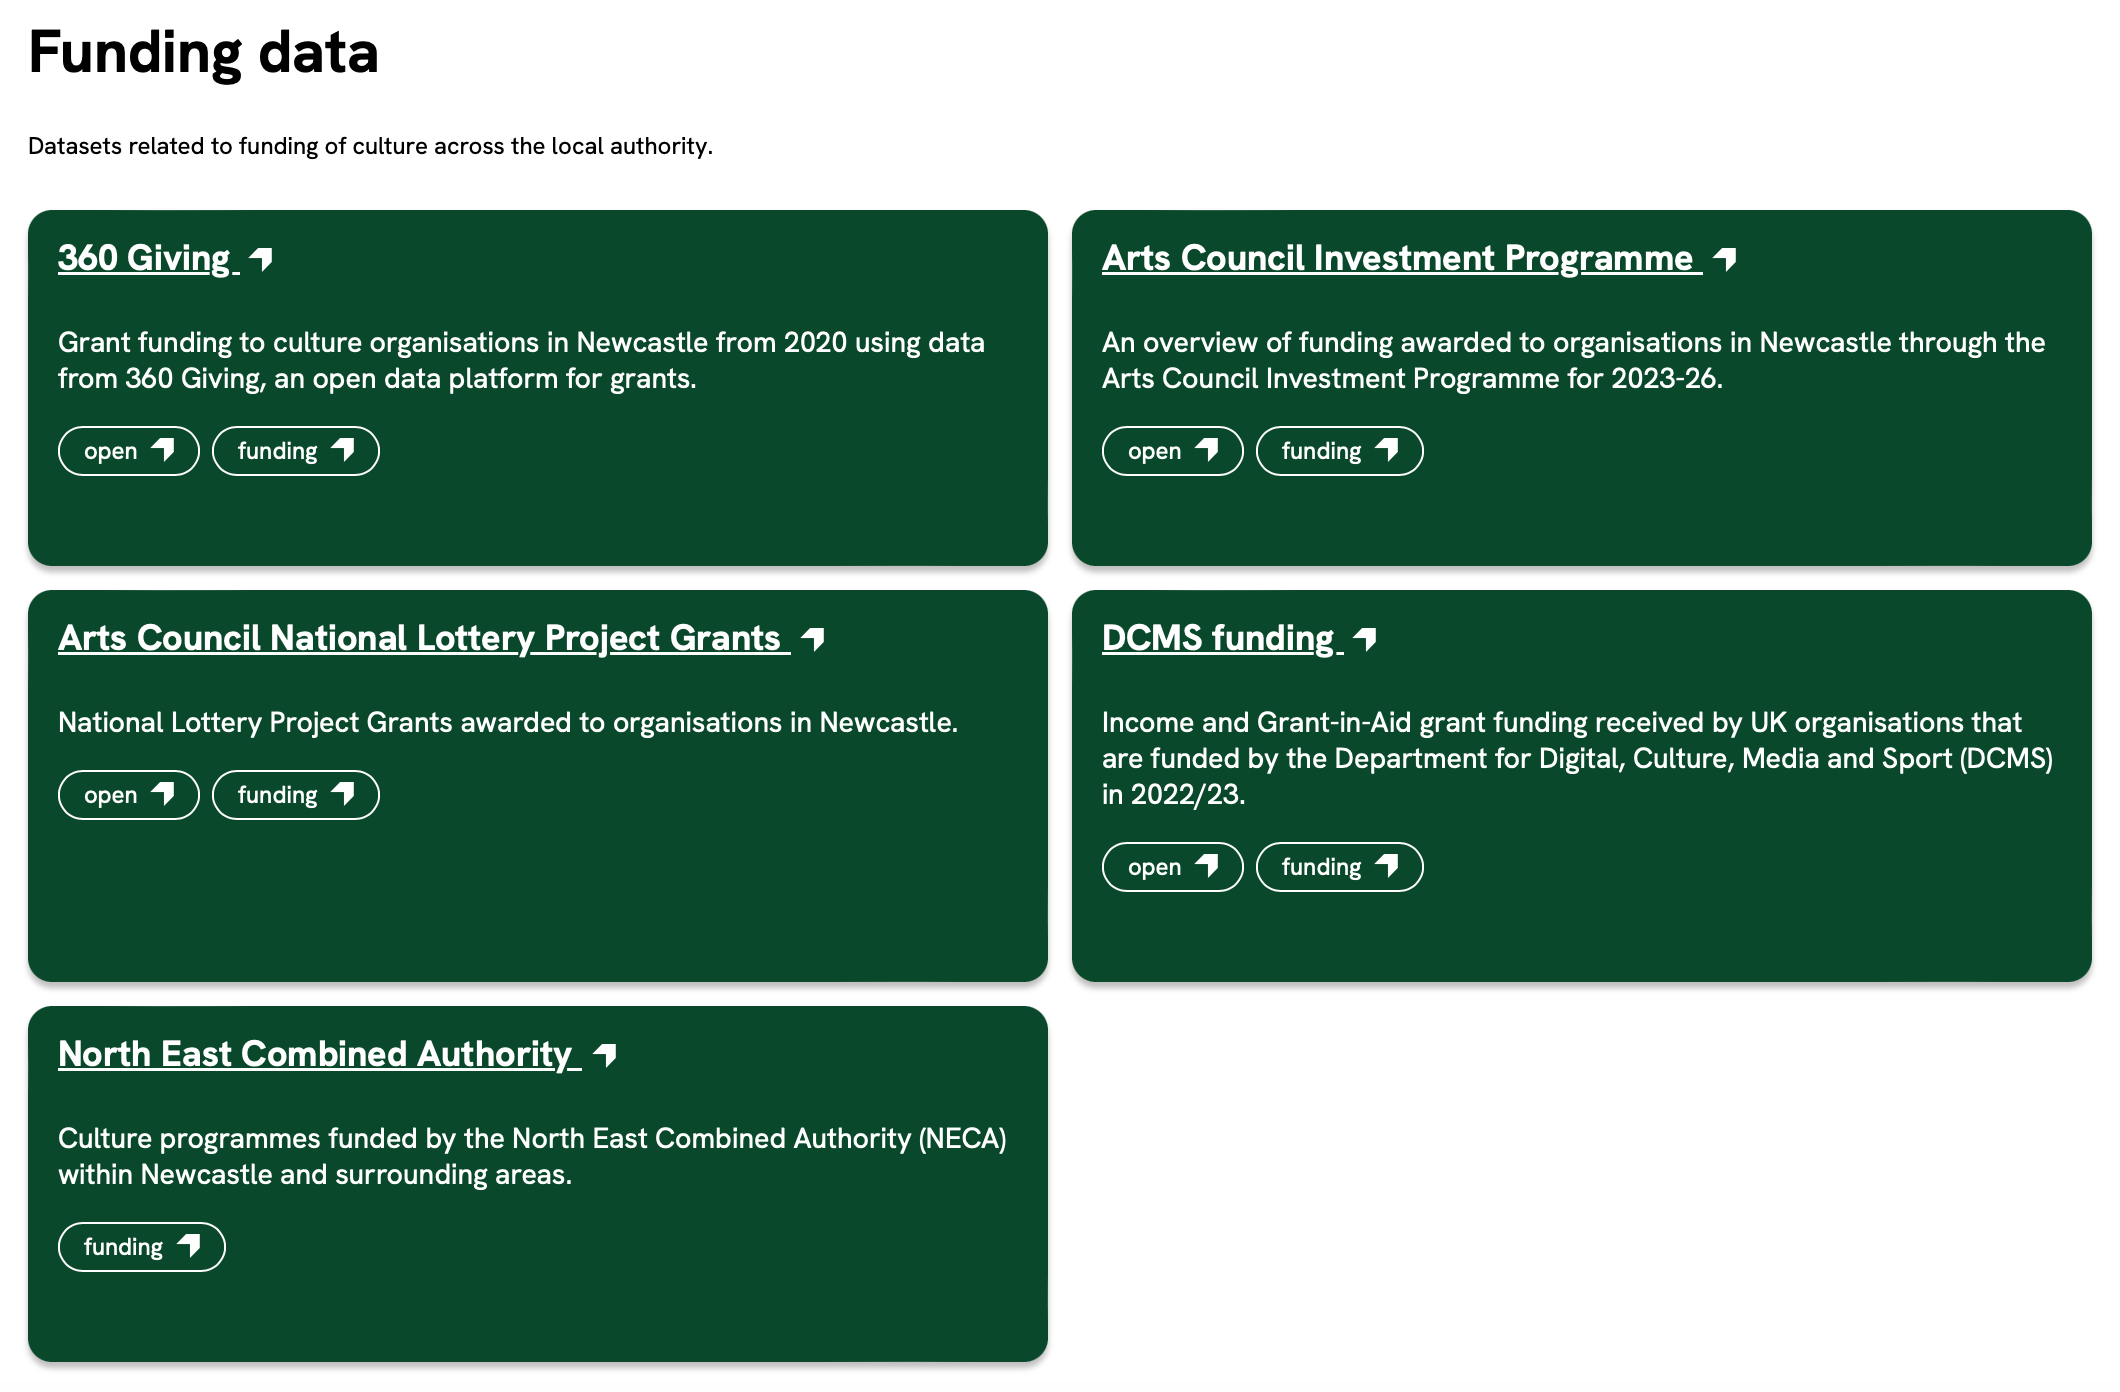
We found that there is far more open data available on funding than on participation, and this lack of participation data is a significant gap. Without data on who is engaging with cultural activities, particularly at a local level, it's hard to make informed decisions.
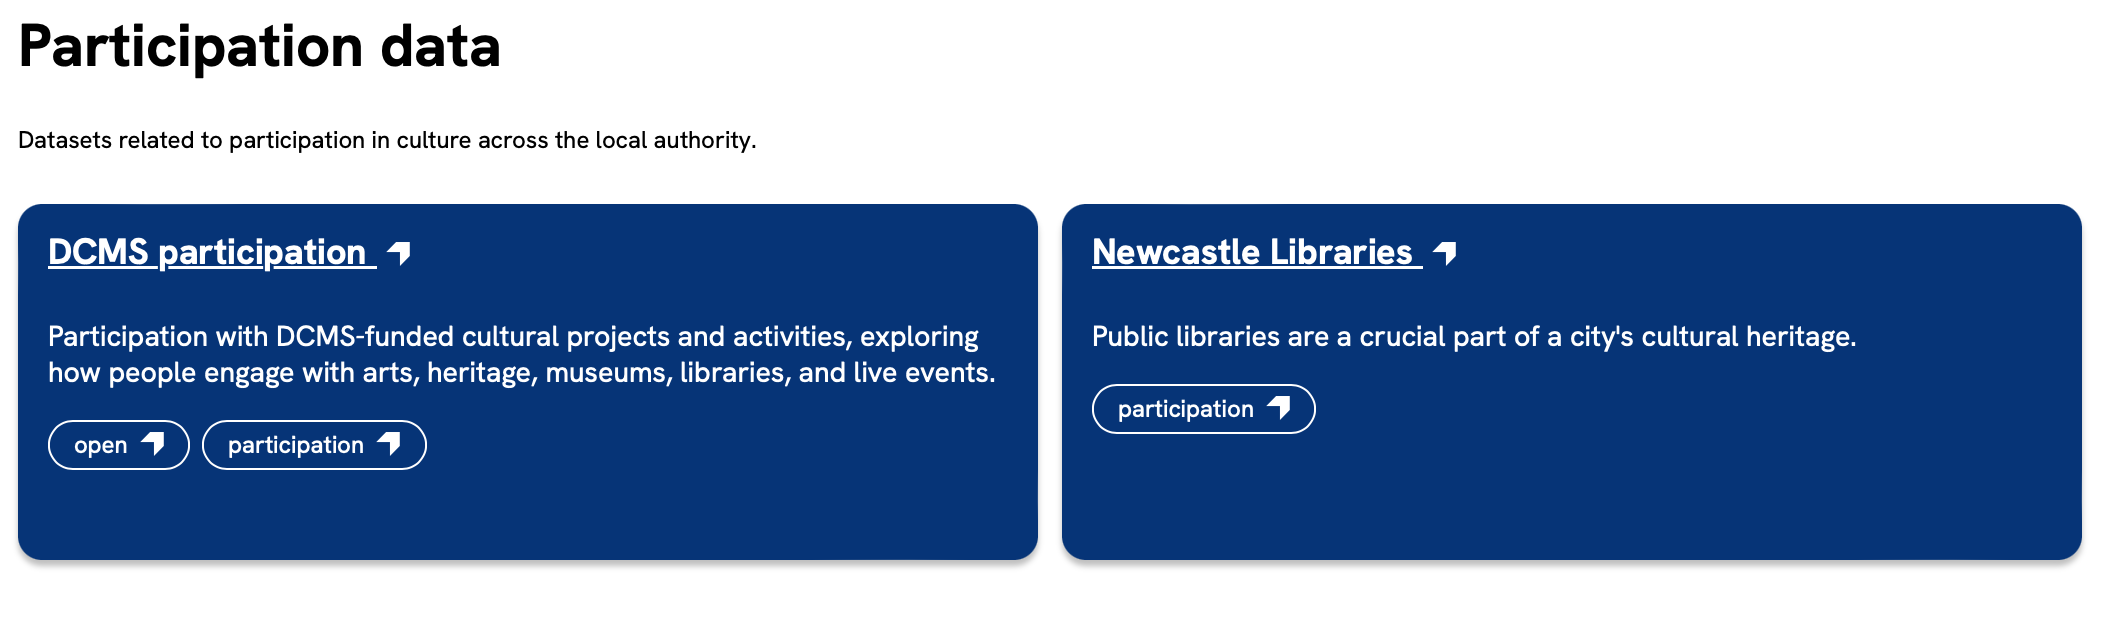
Regional data on participation is essential because different regions have different socio-economic profiles, behaviour patterns, and resources.
Regional data
To understand the Newcastle region better, we added a Regional data section to the website.
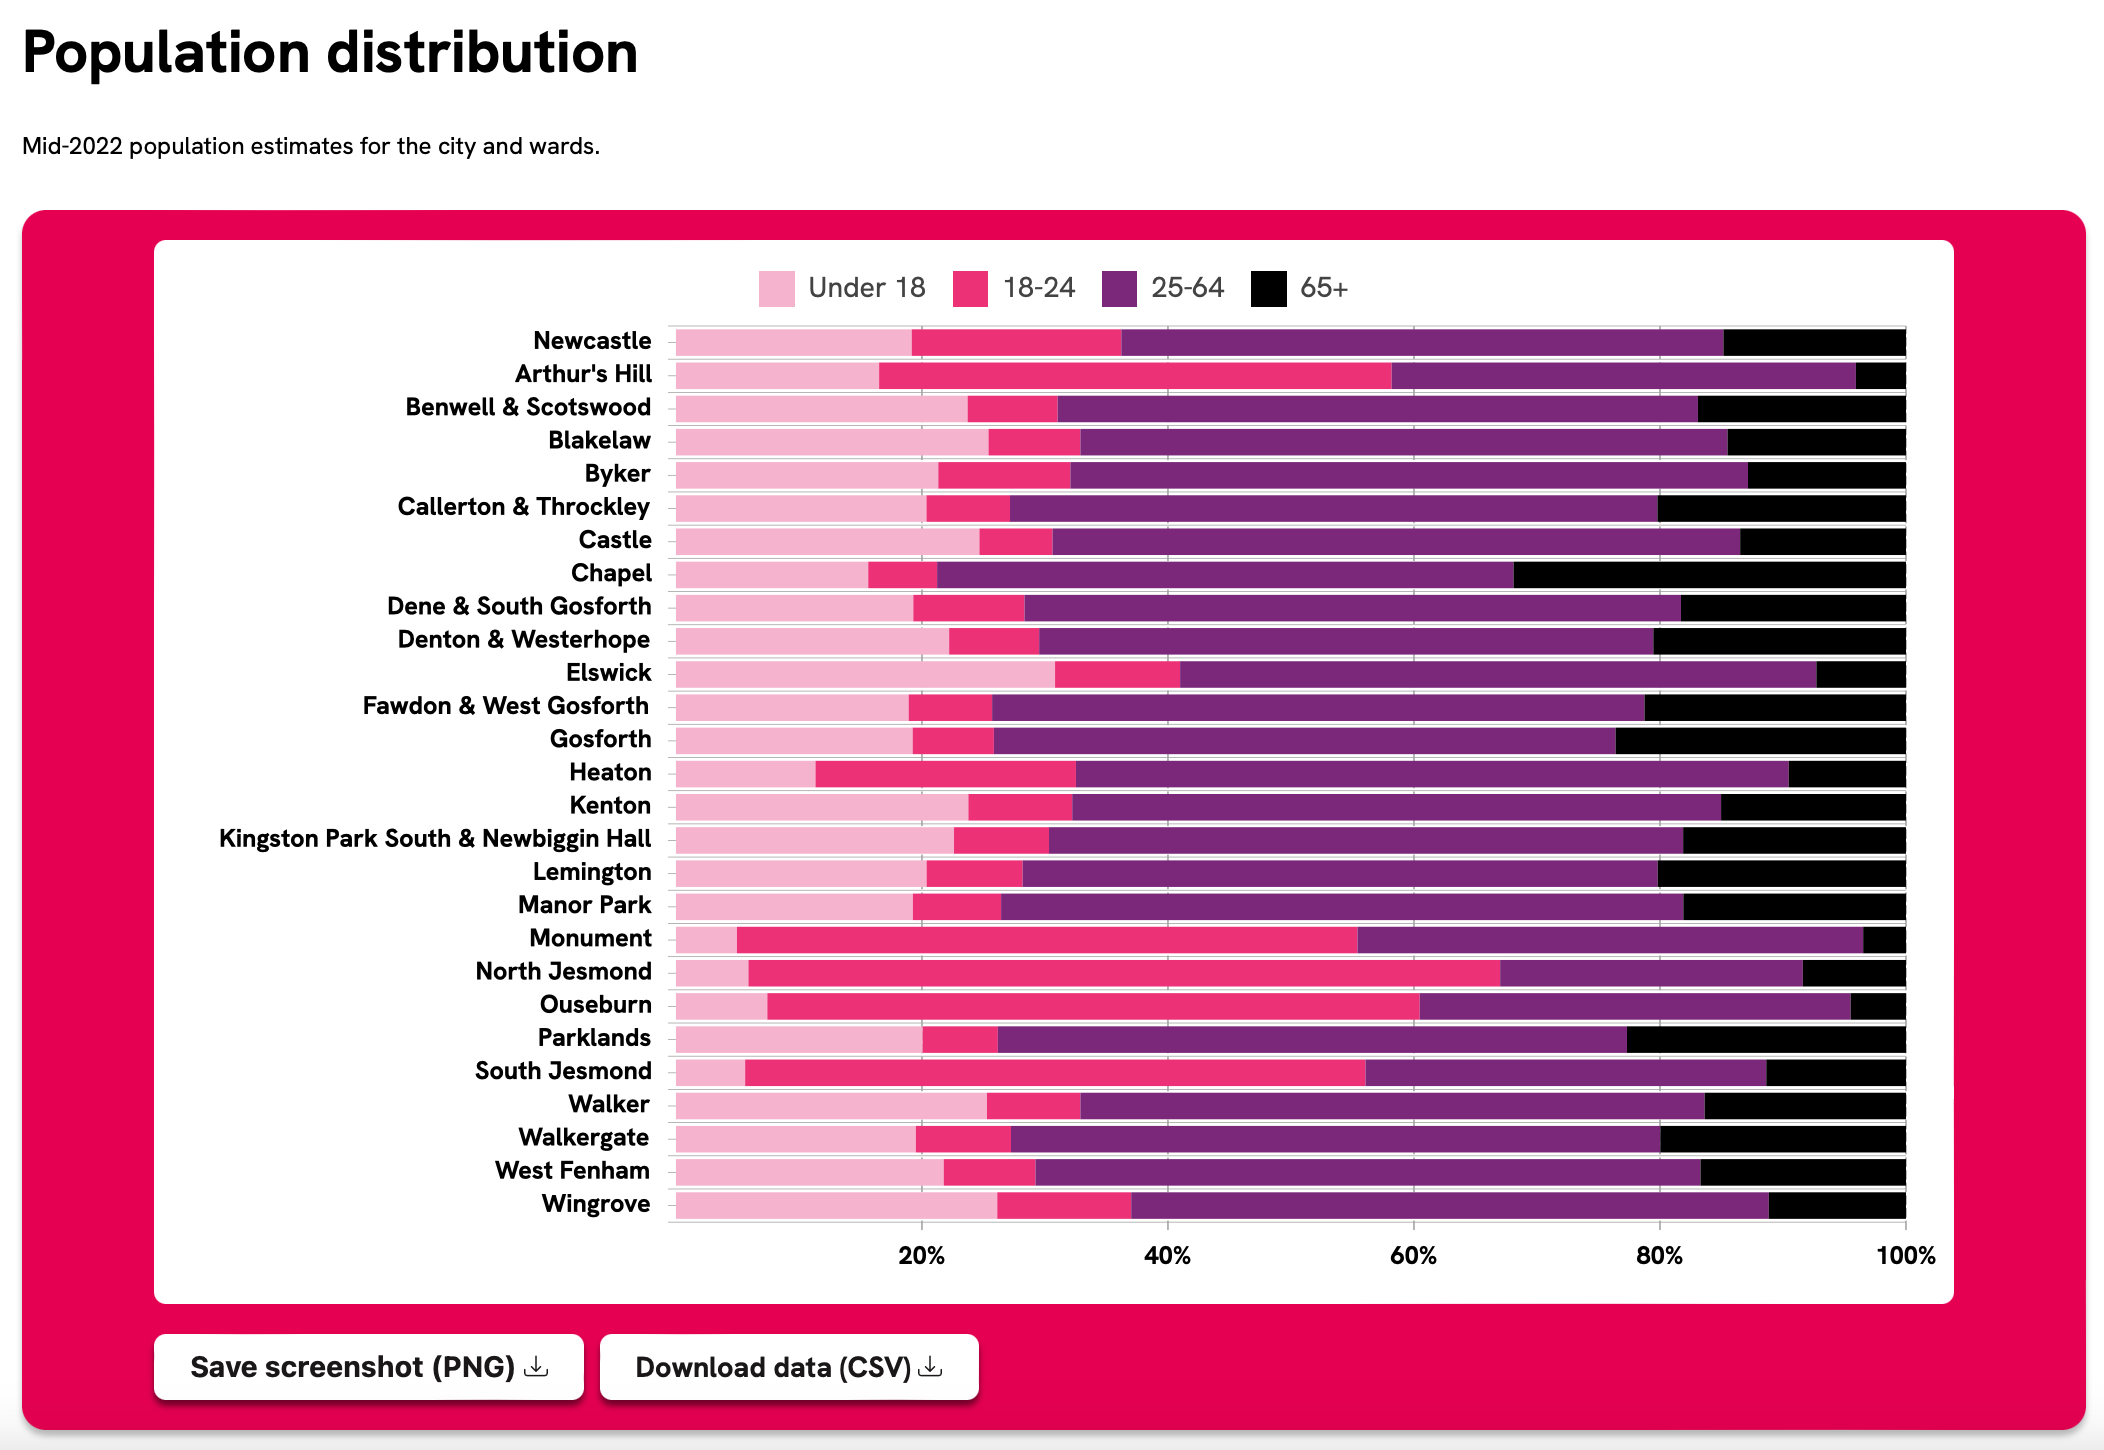
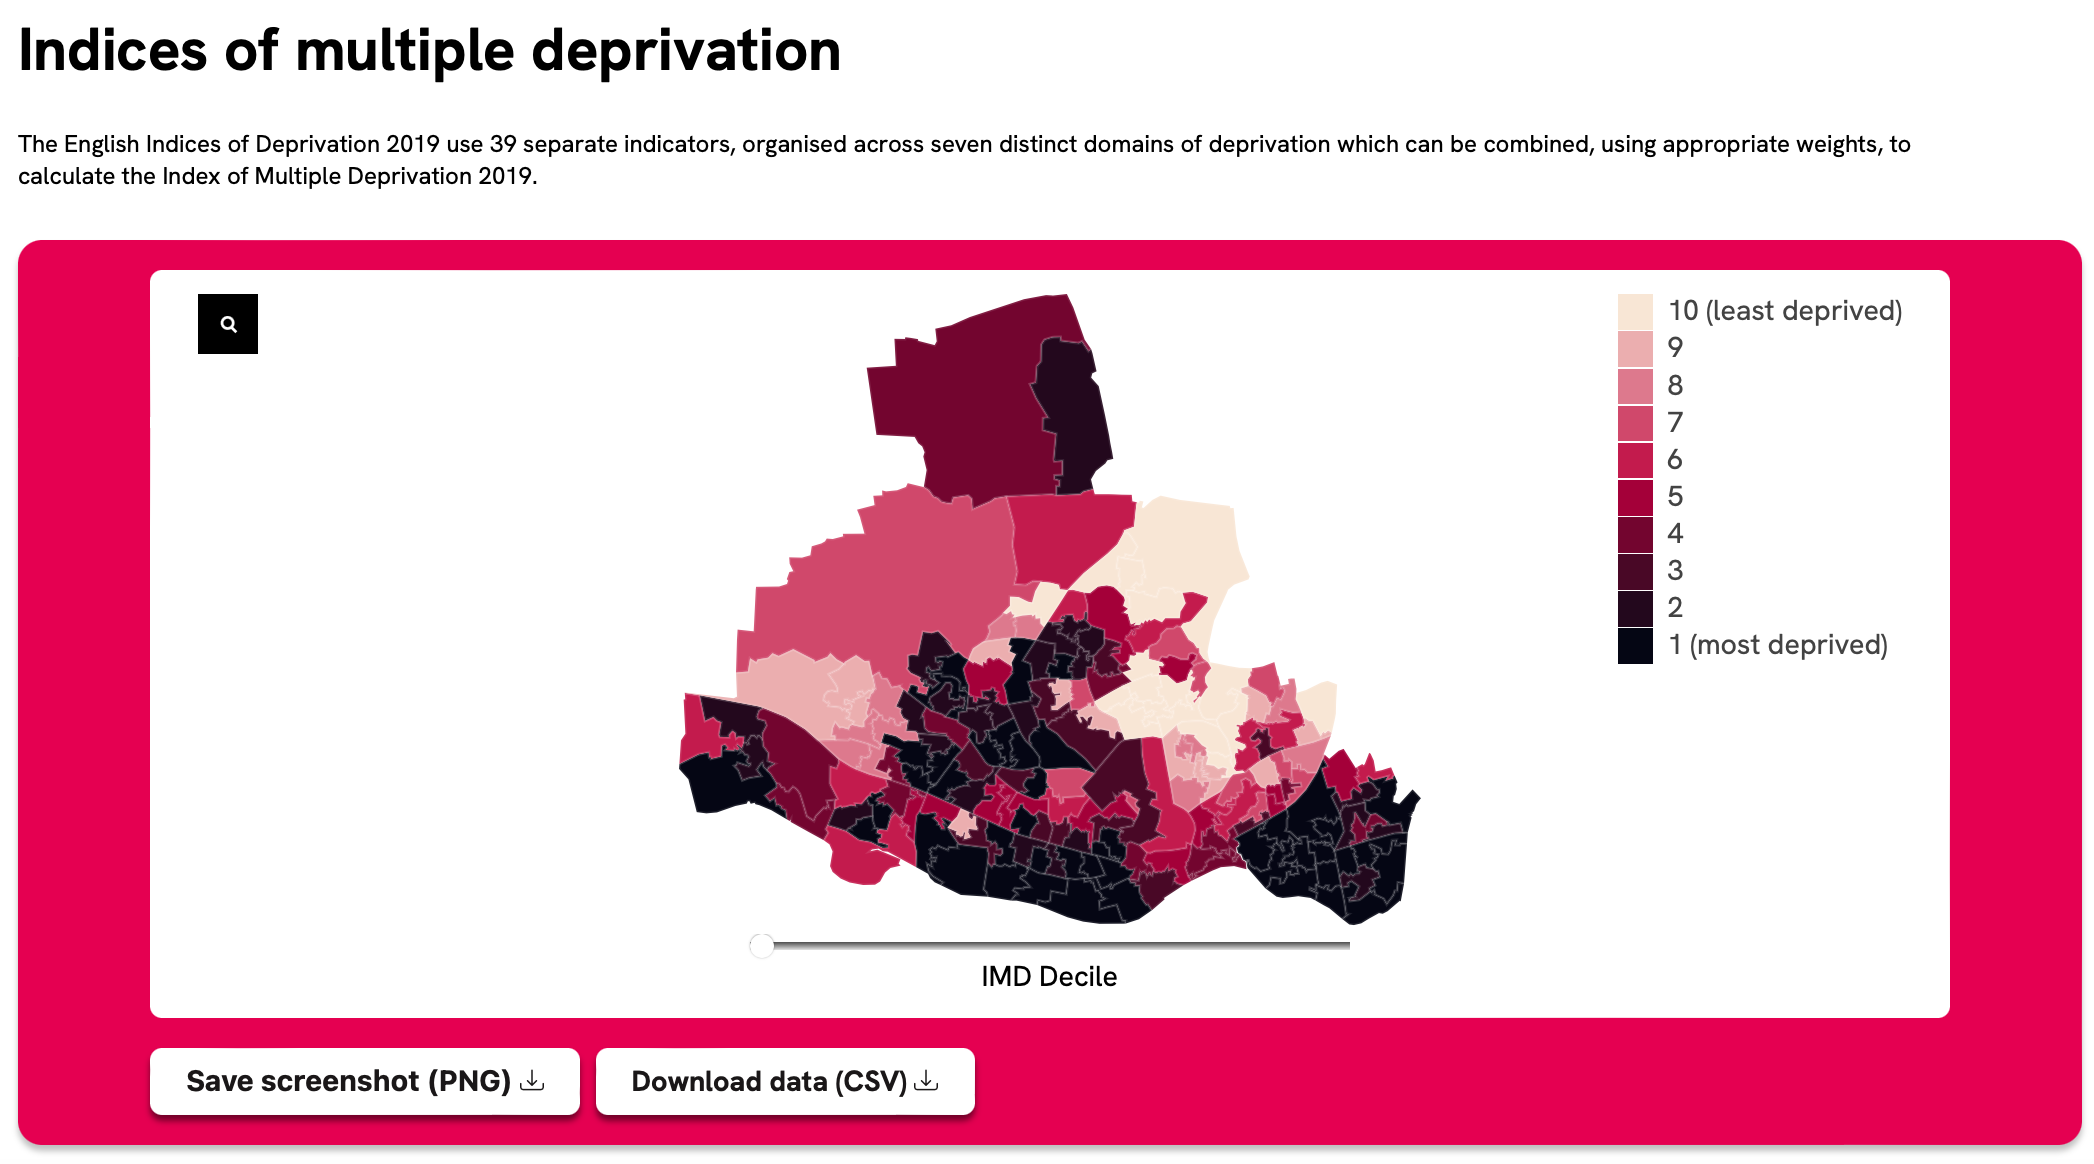
This includes national statistics for Newcastle that were extracted, processed and visualised using data from the Office for National Statistics. This page breaks down the demographic and socio-economic makeup of Newcastle such as age, income indices of multiple deprivation (IMD) and benefit claimants - all potential influences, or barriers, for cultural participation.
We also did some unique analysis of Newcastle's current cultural offering. This includes the number of cultural organisations, their locations, and the types of activities they provide. You can explore this data on the Culture sector page, where we also define what we mean by a culture organisation down to the SIC code level. This helps to explore the relationships between organisations and the services they offer.
Organisation-level data
We realised there are significant gaps in understanding what culture organisations do and who is engaging with them. This makes it very difficult for policy-makers to quantify the sector's impact or value.
To address this, we started working directly with organisations in Newcastle. We wanted to understand their levels of data maturity, what resources they have to collect, use and share their data, and what barriers might exist that prevent the sector from generating this important data infrastructure.
We worked with a small group of organisations to gather data on their funding and participation, which is visualised on the Organisations page. Whilst this is a small handful of organisations, it demonstrates how publication of simple dataset can give important information about the sector as a whole.
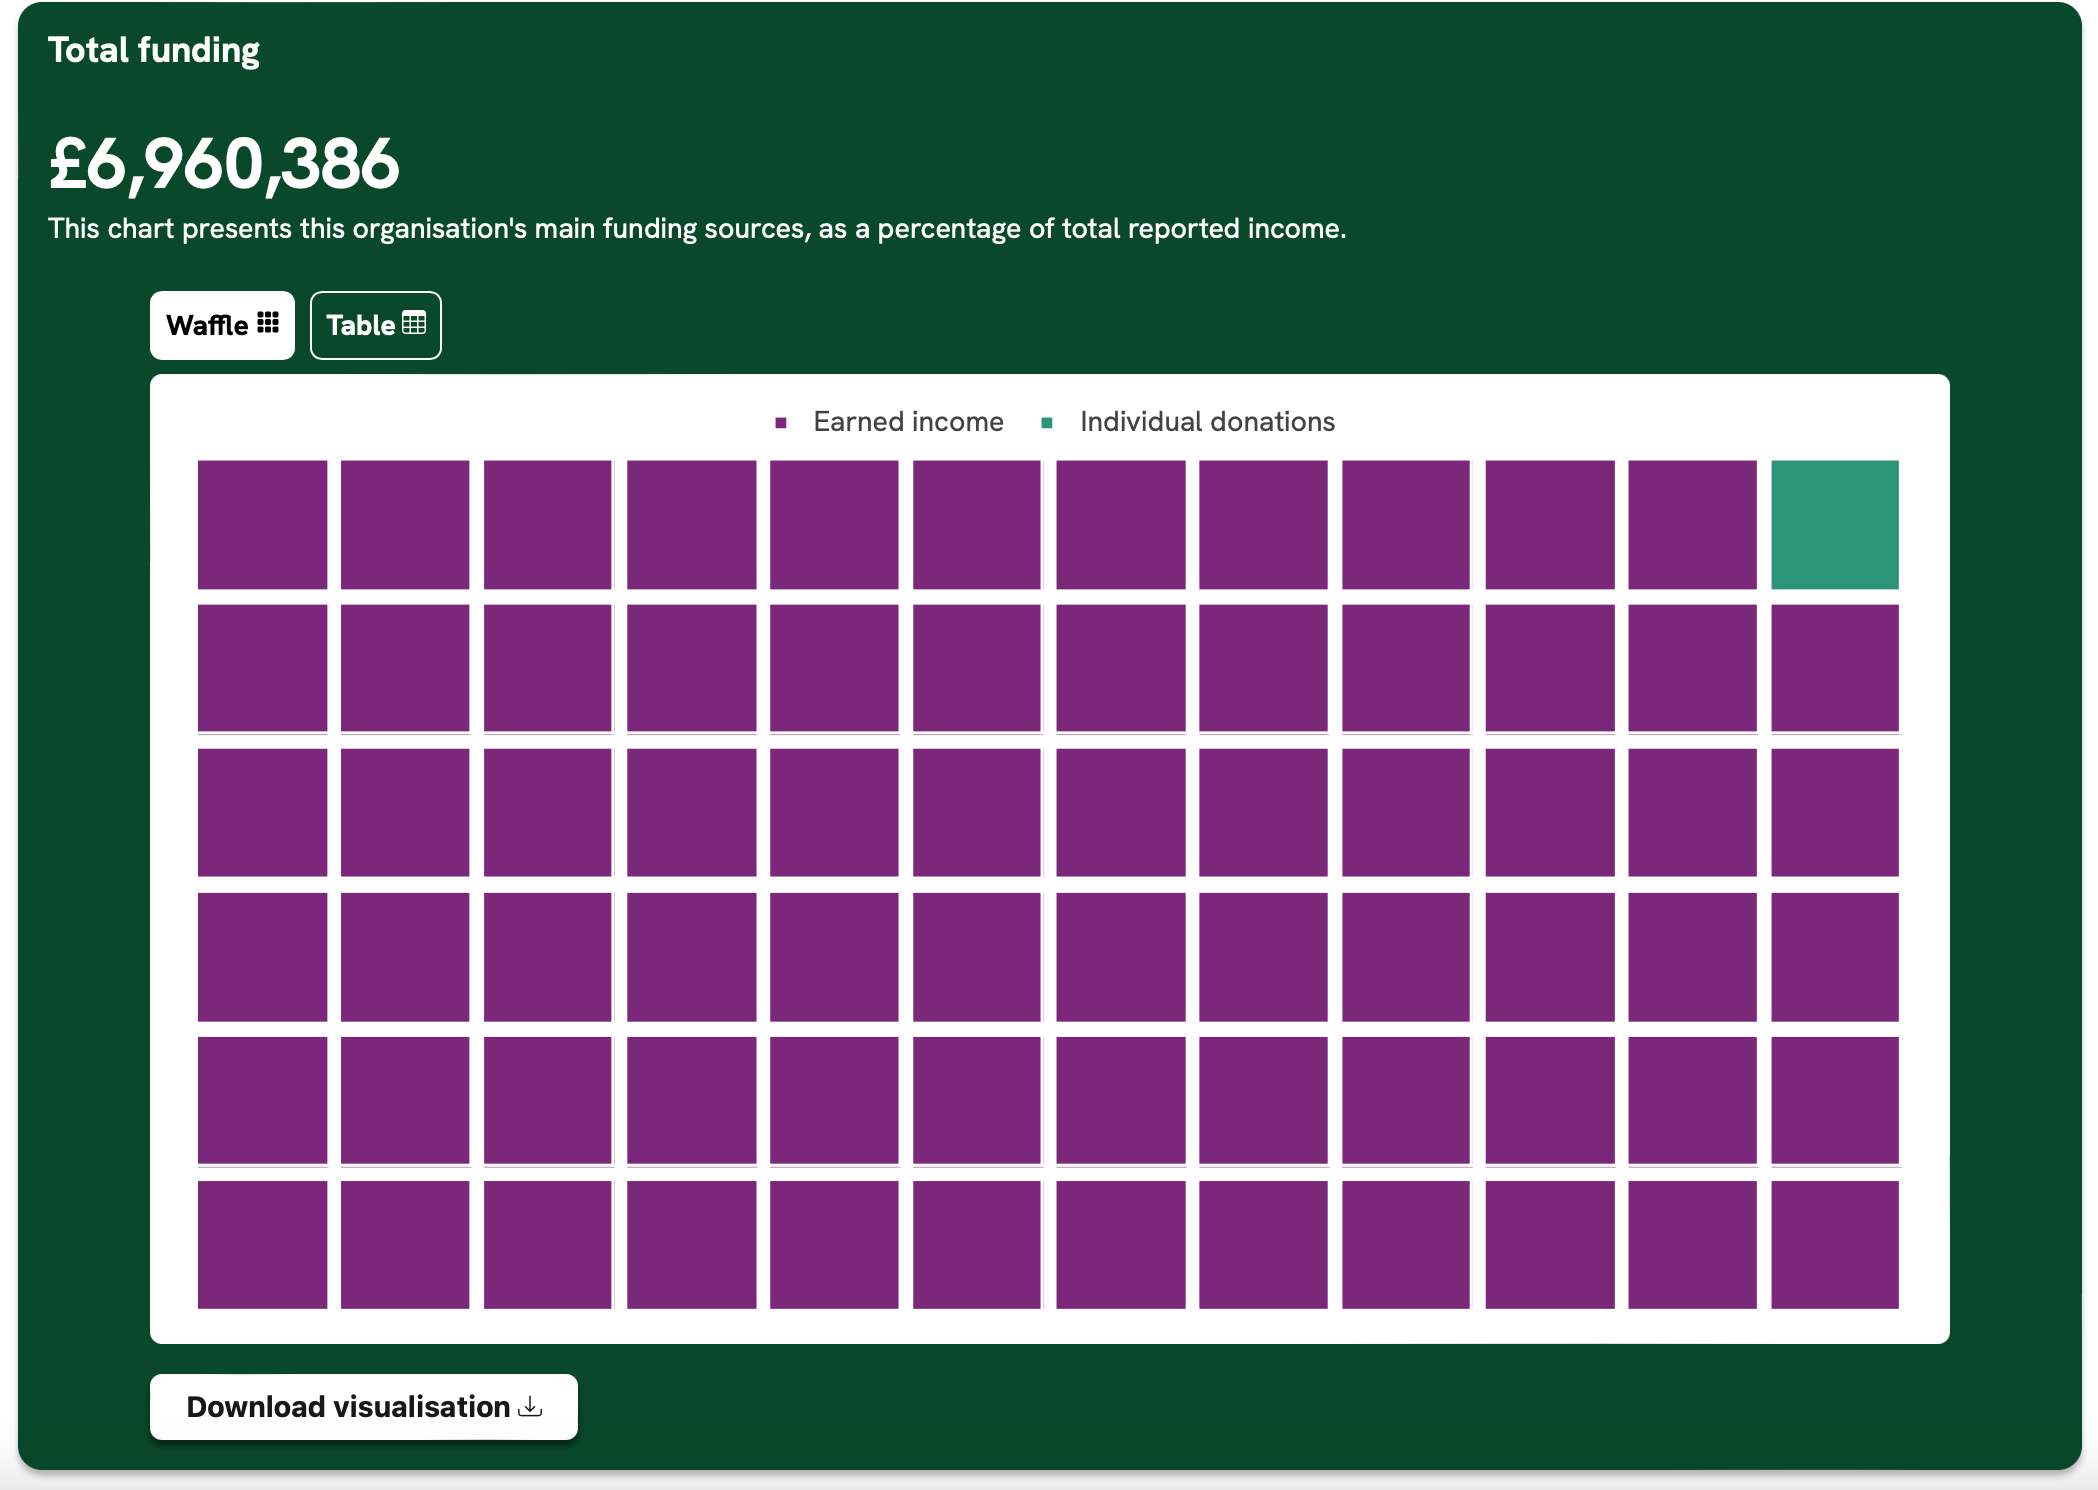
For example, we saw that organisations like Centre for Life rely heavily on privately earned income, while others like North East Museums are mostly publicly funded. Having access to this information is essential when making investment decisions for the region.
Case studies
While working with these organisations, it became clear that they needed support to get the most value from the data they collect, especially in relation to participation and engagement. Organisations had very different approaches to collecting this data, and many did not have the capacity to perform analysis of their own data for decision-making.
However, they recognised the value in using data to gain a deeper understanding of their audiences, particularly for improving quality of services, improving accessibility provision, and demonstrating their impact to secure funding.
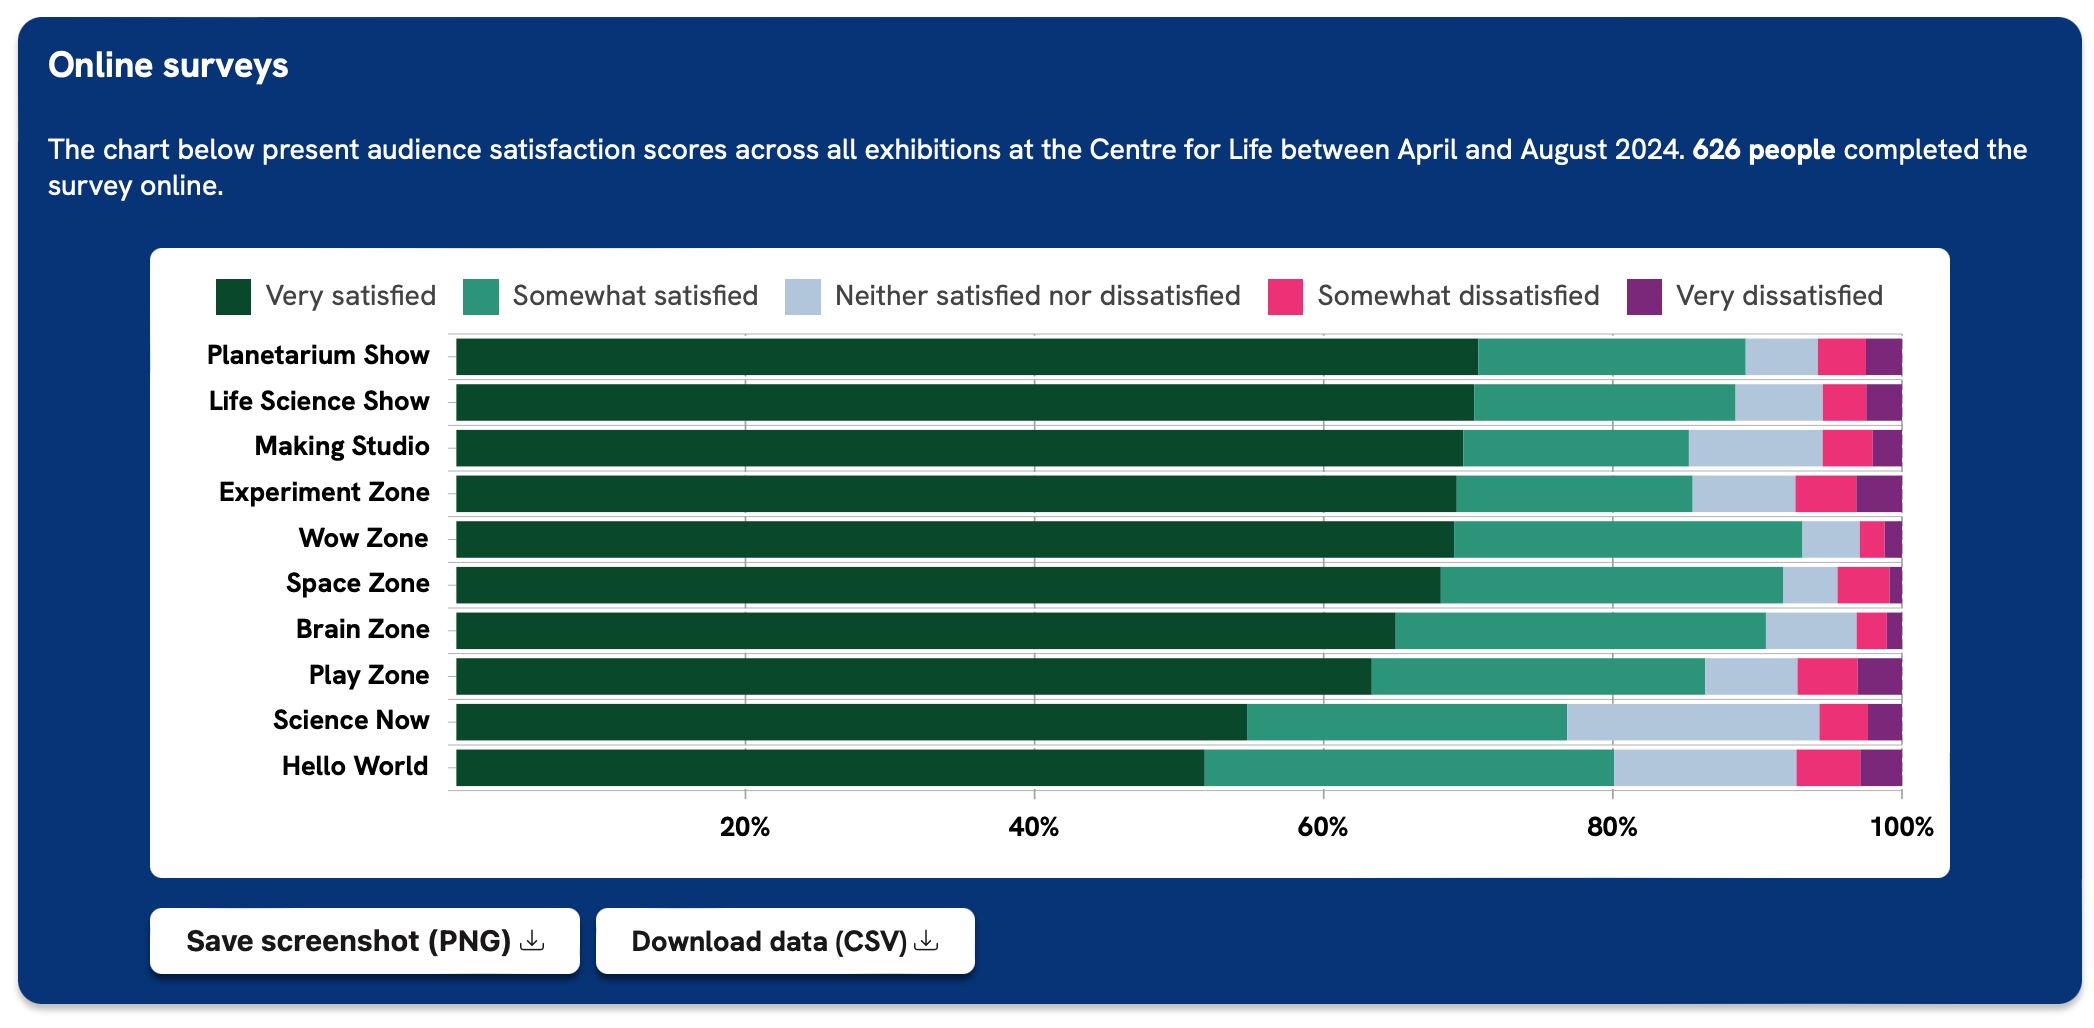
We worked with them to better understand their data via three case studies. These case studies enabled us to dig deeper into the participation data being collected, providing information that directly benefits the organisations, while starting to address the data gaps we've identified.
The outputs and data from these case studies are published on the data observatory.
By sharing these outputs on the web, culture organisations can see the approach that others have taken to evaluation and, rather than developing their own from scratch, can learn from others.
Insights and sector-wide analysis
By collecting data from the four pilot organisations in a standard format, we could use the data observatory to demonstrate the type of cross-sector analysis this could enable.
Funding
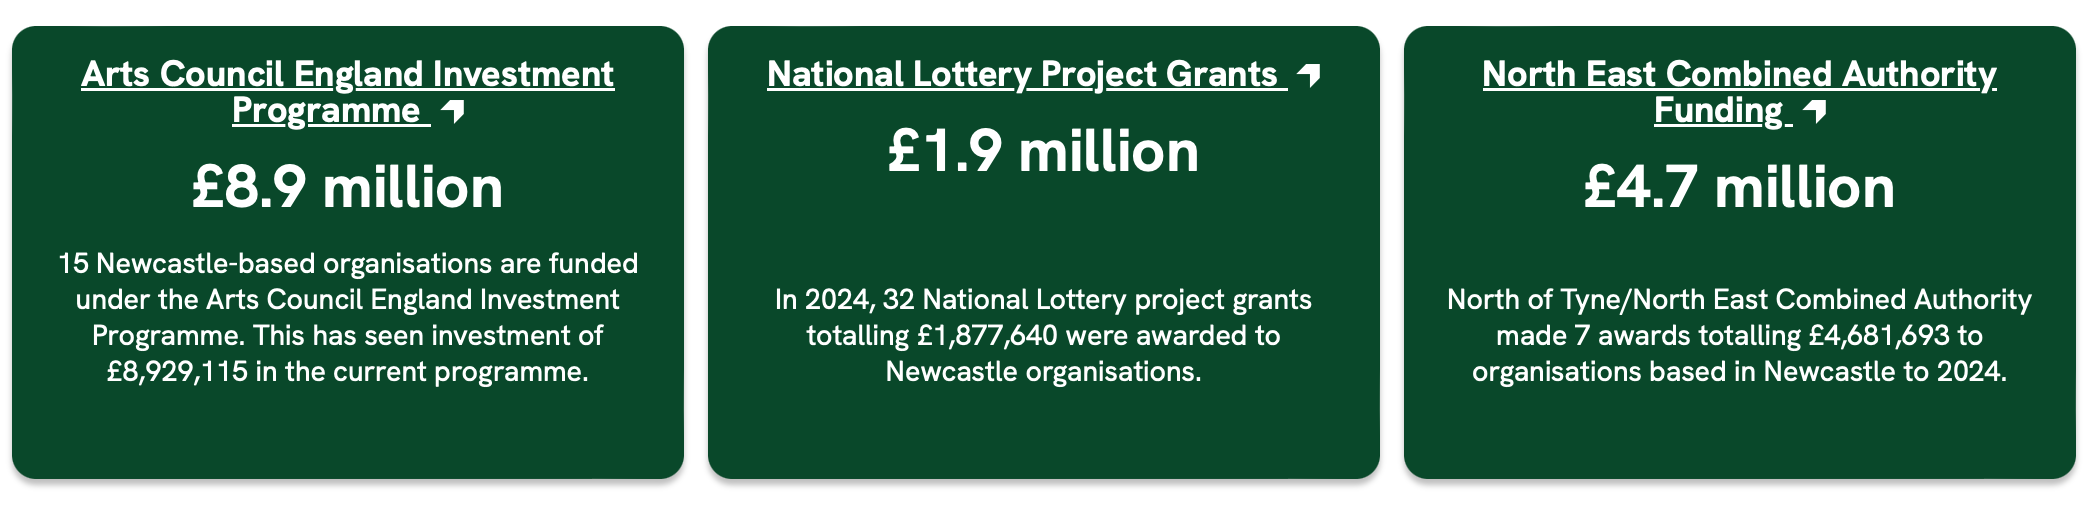
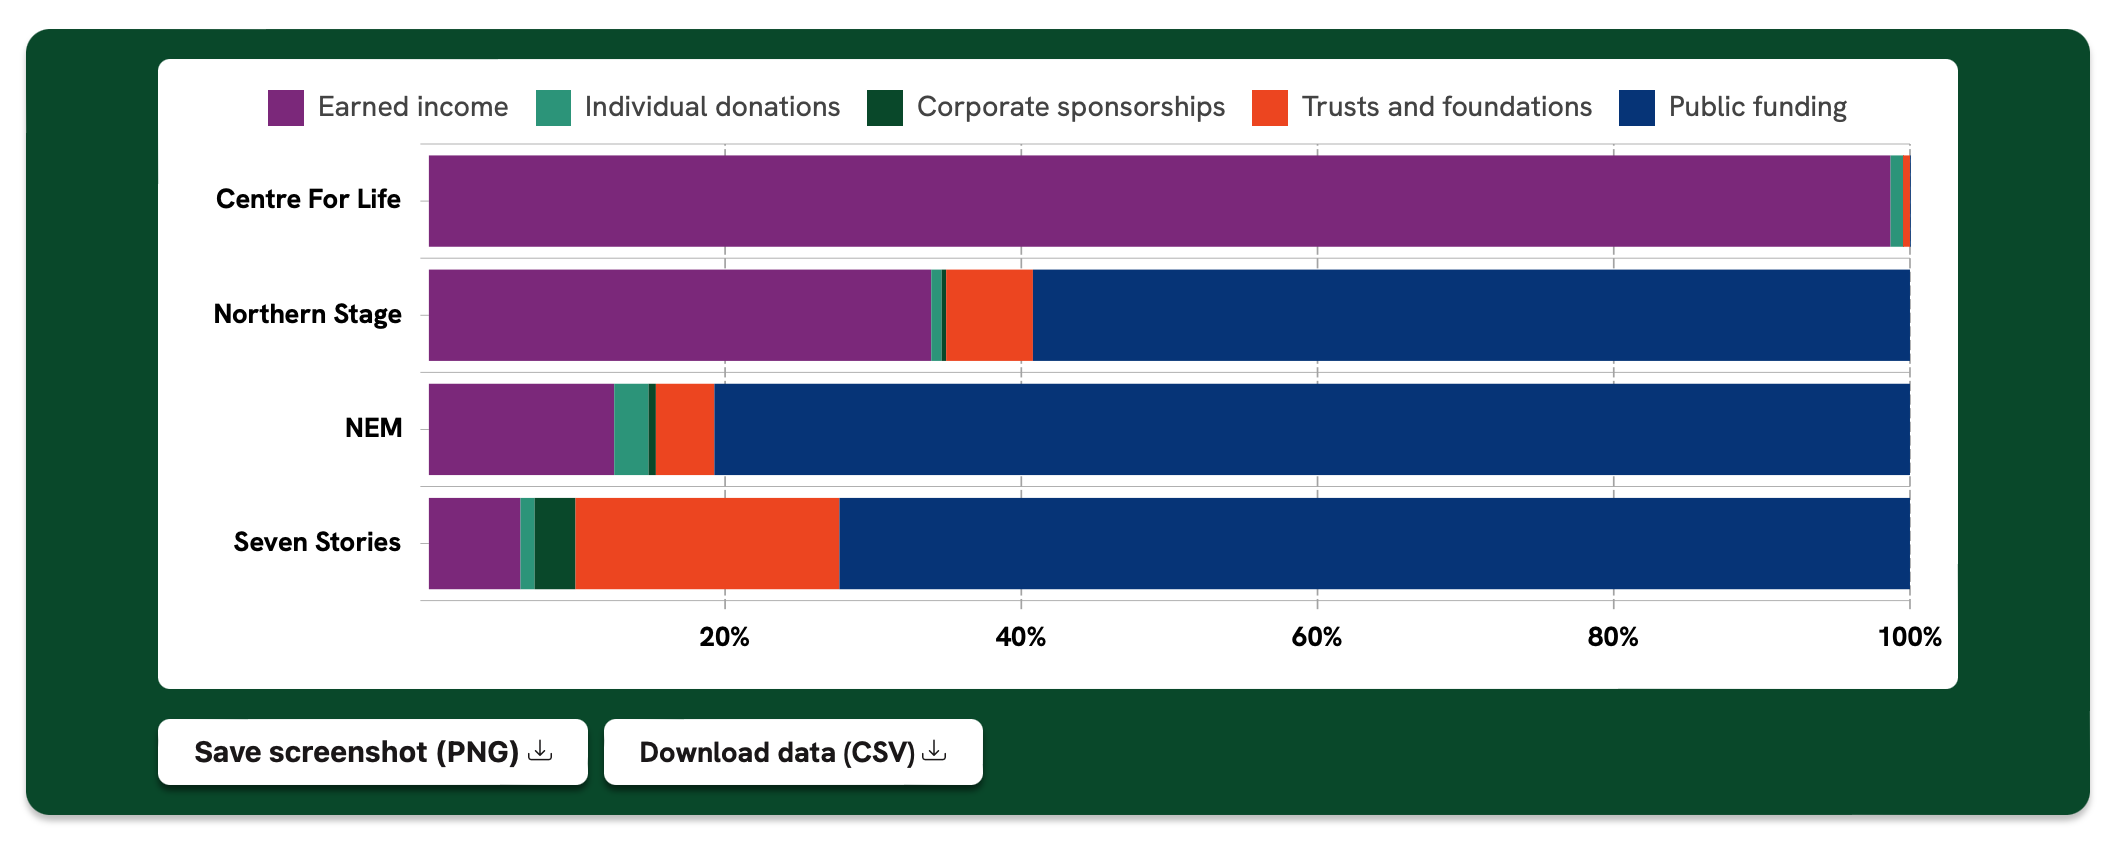
Newcastle-based culture organisations receive funding from a variety of different sources, with the exact profile varying widely between organisations.
We collected funding data from four organisations to understand this variance at the organisation-level. If more data were published by organisations in this way, it would then be possible to cluster and analyse the groupings of organisations by reliance on different funding sources.
Credit: Open Innovations
Engagement
From the case studies, we learned that organisations use very different approaches to evaluate their own activities - for example, how many people engage with or attend their activities, and what kind of experience do they have?
Standardising data collection methods for this type of evaluation could help paint a clearer picture of cultural participation at the local level - for which the data does not yet exist.
To address this, we developed a simple taxonomy to categorise engagement activities and audience types. This approach will help provide consistent, comparable data across organisations, regardless of size, resources, type of services offered or data maturity.
Using this taxonomy, we grouped the participation figures shared by pilot organisations and created an aggregate sum of participants by activity and audience type.
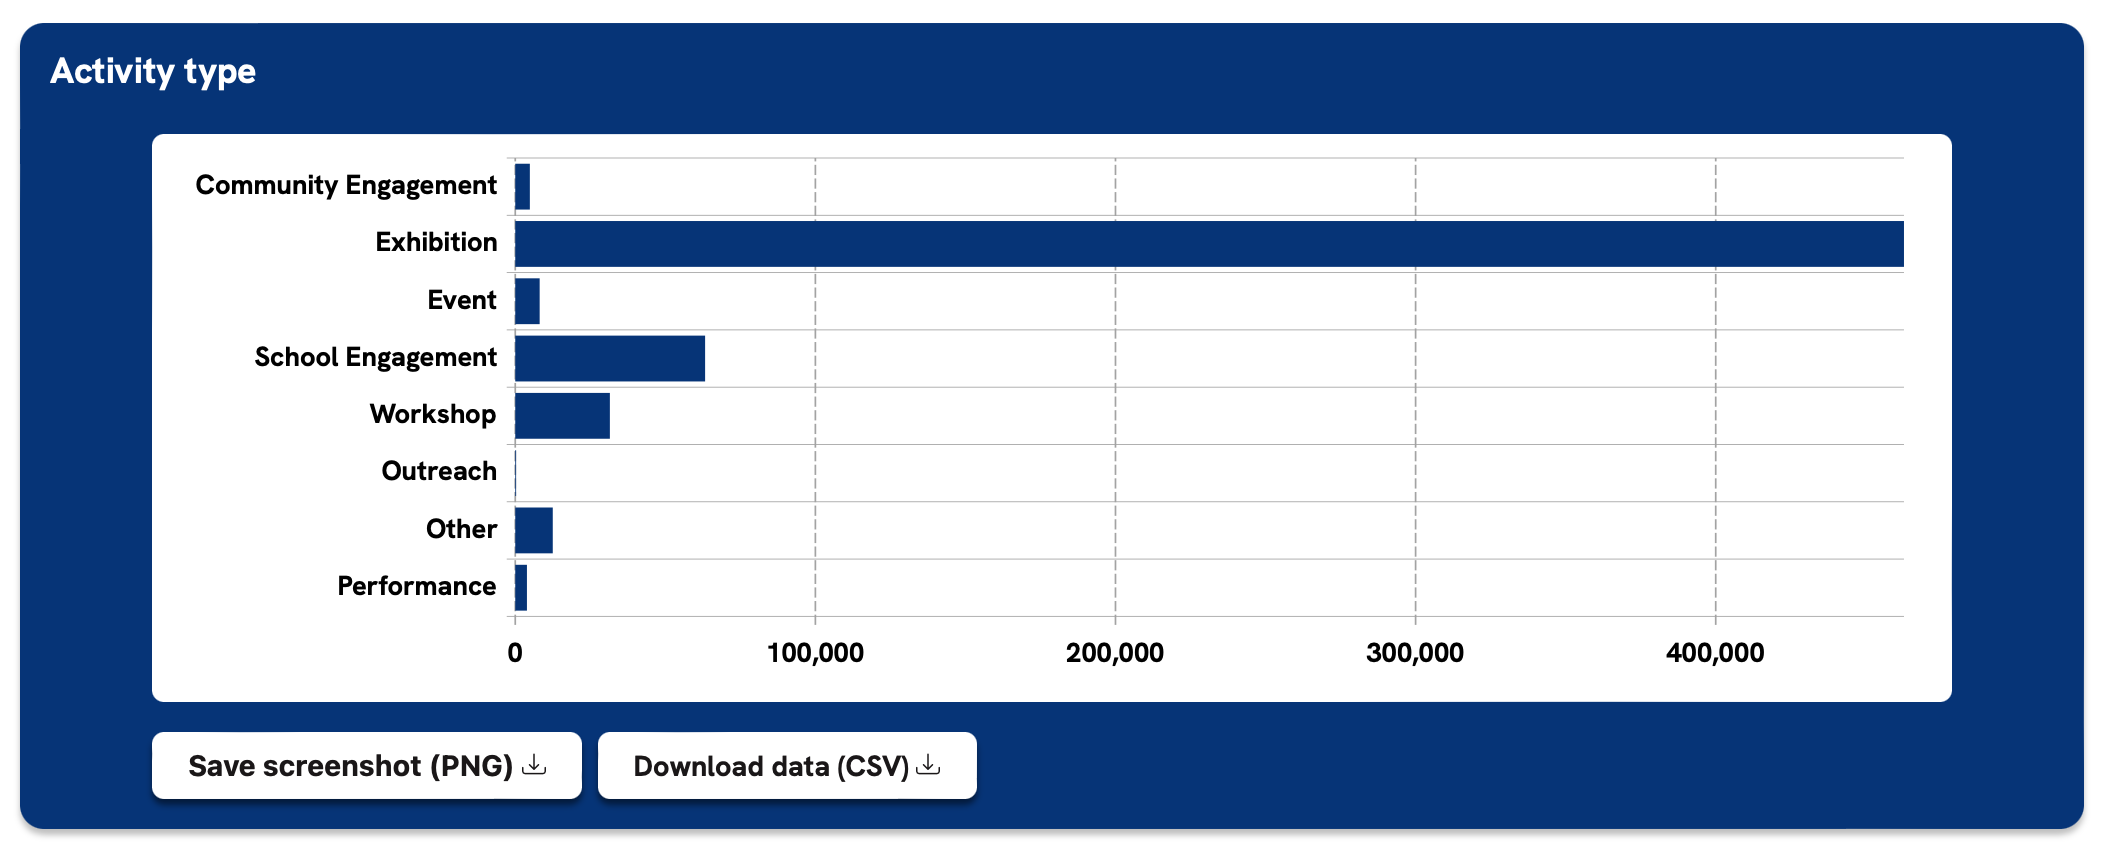
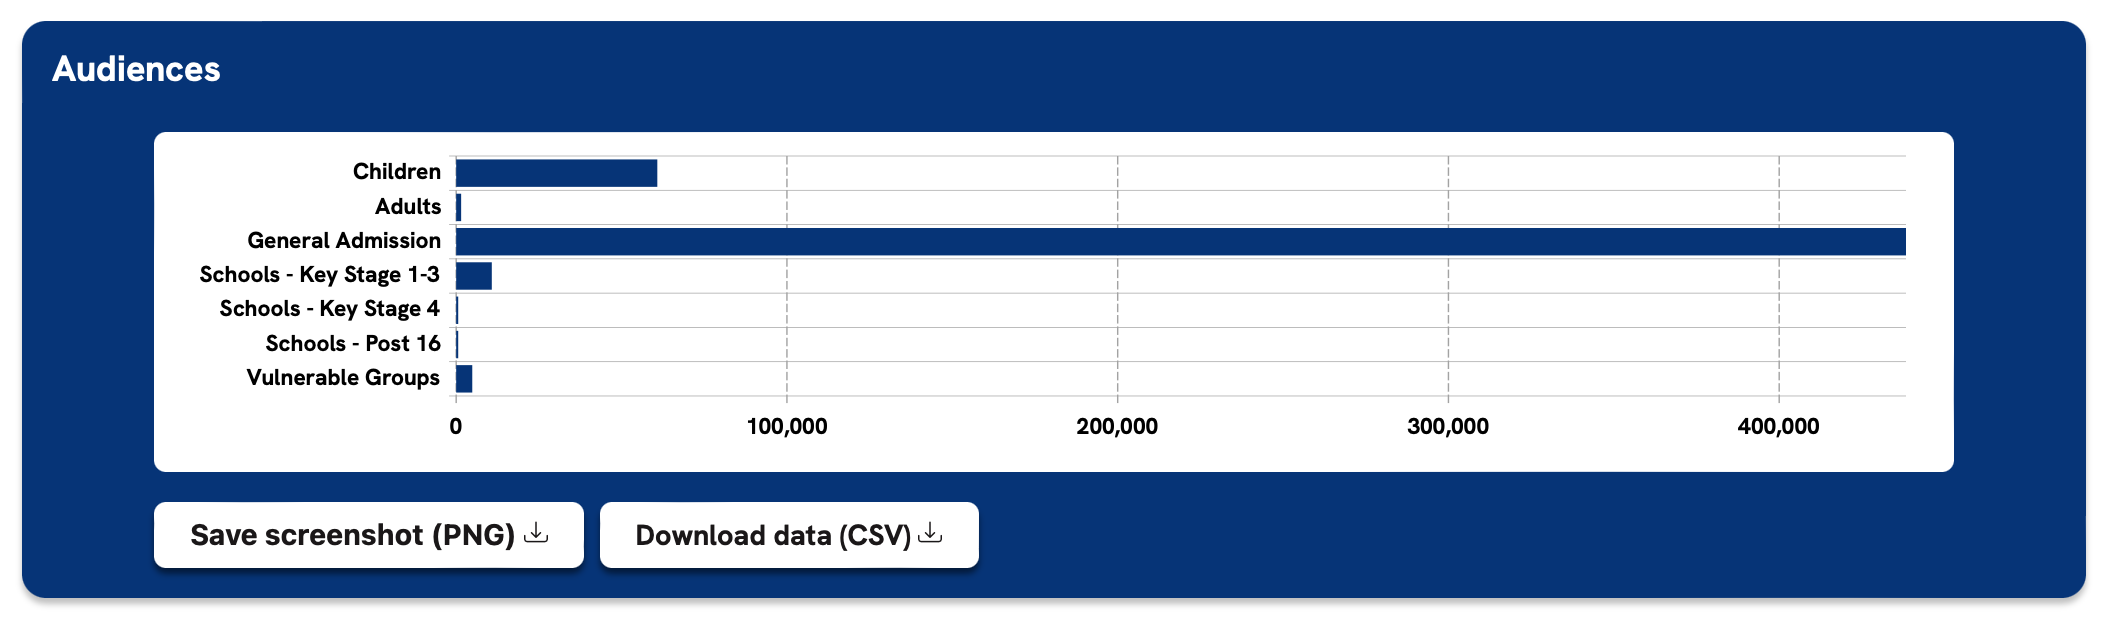
This demonstrates in principle how this approach can be used to create this missing data infrastructure, simply by mapping their existing evaluation data to a standard taxonomy and publishing their data on the data observatory.
The taxonomy is a proof of concept and needs validating to ensure it reflects the range of activities being offered in the sector. In future, we recommend expanding the pilot study to include more organisations and test the taxonomy, using feedback to refine the model.
Read more about this taxonomy and how it can be used on the Engagement page.
What we've learned
The level of data maturity varies greatly between organisations. Many culture organisations need support to improve how they collect and use data. This might explain why there are gaps in publicly available data on participation in this sector.
We learned that, while organisations are collecting this type of data, they all use a different approach to categorising and evaluating their activities and audiences. This makes it difficult to compare results between two organisations.
Support is needed to enable these organisations to start collecting and sharing good quality data on their activities and audiences. This is as much a cultural shift as it is a matter of skills and capacity.
With projects like Culture Connect, these data and skills gaps can be addressed. By working with organisations directly, we've started to improve on existing data infrastructure for the Newcastle region.
In future iterations of the data observatory, this will likely expand to more organisations, and more regions, and will start to paint a clearer picture of the sector as a whole.
Conclusion
We're excited to share the progress of this project and would love to hear your thoughts. If you're interested in collaborating on this or other projects, feel free to contact us at hello@open-innovations.org.