'%3E%3C/circle%3E%3C/g%3E%3C/svg%3E)
All the bus, tram, metro and rail stops in Great Britain
Recently, Stuart added constituency maps of all the ATMs, post offices, and pubs in the UK and all the fish and chip shops in the UK to our constituency site. As he was doing this work, he asked us if there was anything else we wanted to see using the OpenStreetMap data. I suggested bus stops.
Stuart pointed out that I already had all the data on bus stops! In our most recent project on buses with Liverpool City Region Combined Authority, we had downloaded the locations and details of every bus stop in Great Britain from the National Public Transport Access Nodes (NaPTAN) dataset. All I needed to do was figure out which constituencies they were in, add it to the site with some descriptions, and I was done.
NaPTAN provides access points for all modes of public transport, not just buses. It includes stops, platforms and entrances for buses/coaches, rail, tram/metro, ferry, air, car, taxi and telecabines. A constituency map would mostly be empty for some of those transport modes, but buses/coaches, tram/metro and rail were all viable.
Assigning stops to constituencies
To determine which constituency a transport access point is in, you first need to know where it is. Typically, you would use a latitude and longitude to represent a point on Earth. However, not all the access points in the data had latitudes and longitudes. Instead, they had eastings and northings, which was annoying. This meant I had to convert all the eastings and northings to latitudes and longitudes. Fortunately, a Python package for converting British National Grid eastings and northings (OSGB36) to latitude and longitude (WGS84) already exists.
Next, I needed to know where the constituency boundaries lie. I downloaded the latest Westminster Parliamentary Constituency boundaries from the Open Geography Portal in "Generalised Clipped" resolution, which is accurate to 20m. Using geopandas, I loaded both the access point data and the constituencies into geodataframes. I then used a spatial join to determine which constituency contains each access point. Next, I removed any duplicate data and only selected access points with Status == "active". Finally, I counted how many access points were in each constituency per StopType. The results are in available as a CSV and the processing pipeline is written in a Jupyter Notebook.
As an additional step, I used geopandas to calculate the total area of each constituency in square kilometres. I then calculated the total number of stops per square kilometre for the different StopType. This proved to be a challenge, as I needed to take into account how points on a three-dimensional surface are projected onto a planar (two-dimensional) geometry to calculate area.
For example, the most common projection of a map, World Mercator, maintains shape and direction, but distorts areas. Whereas the equal-earth projection maintains relative size of areas on the map, but distorts shape and direction. The former is useful for navigation, while the latter is best for accurate area calculations.
Fortunately, coordinate reference systems (CRS) exist to take care of this, so it was a case of picking the right one.
Stops and access points
What we may think of as an individual "stop" (e.g. a bus stop or train station) may be represented by multiple "access nodes/points". For example, a train station could have a node for its entrance, a node for each platform, and a node for the main area of platforms.
For bus and coach stops, I used StopType==BCT, which corresponds to "On street" bus or coach stops.
For tram/metro and rail, I used StopType==MET and StopType==RLY, respectively, which correspond to "access areas". According to the NaPTAN schema guide, an access area is defined as "an interchange area within the station - typically the main area of platforms". Therefore, by only counting "access areas", this provides an estimate for the number of stations that you could travel between.
Some of these assumptions may be incorrect, but we tried our best to use the two-hundred-and-thirty-seven-page guidance document to make an educated judgement. If you know how we can improve the data, or think we made a mistake, please get in touch or raise an issue on GitHub.
Results
You can find and download the visualisations on the transport stops page.
Bus/coach stops
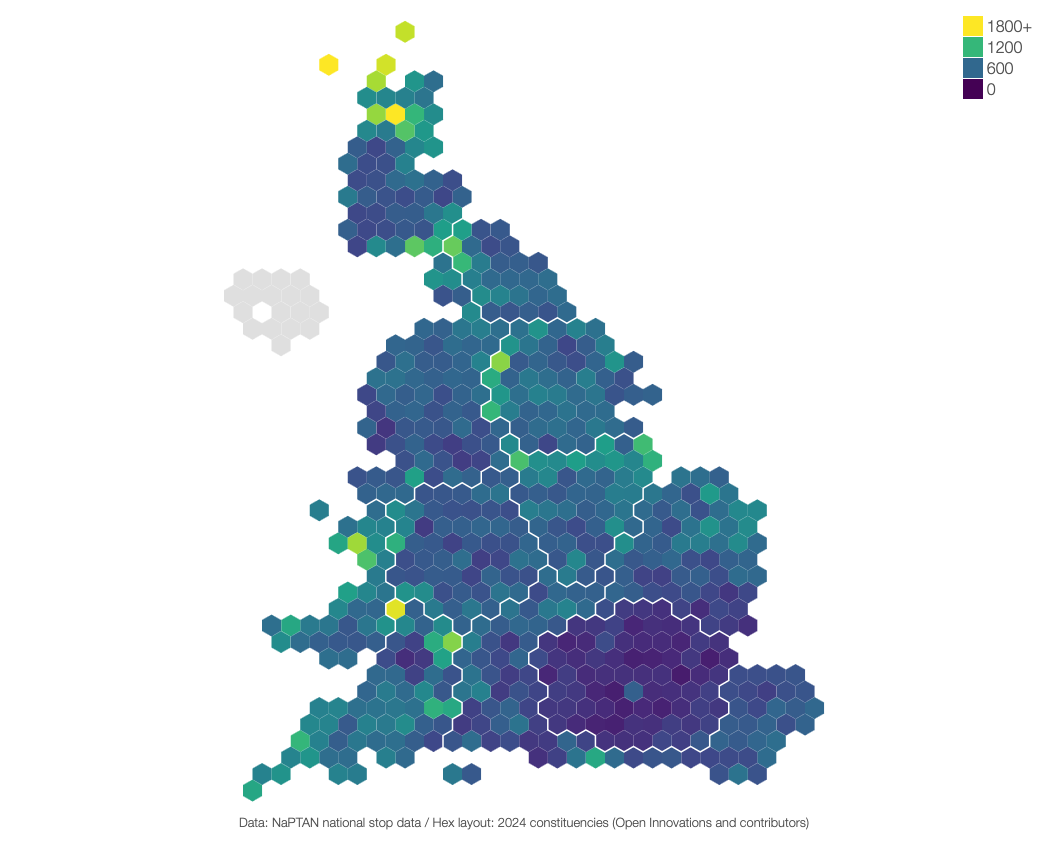
Credit: Open Innovations, NaPTAN

Credit: Open Innovations, NaPTAN
Tram/metro stops
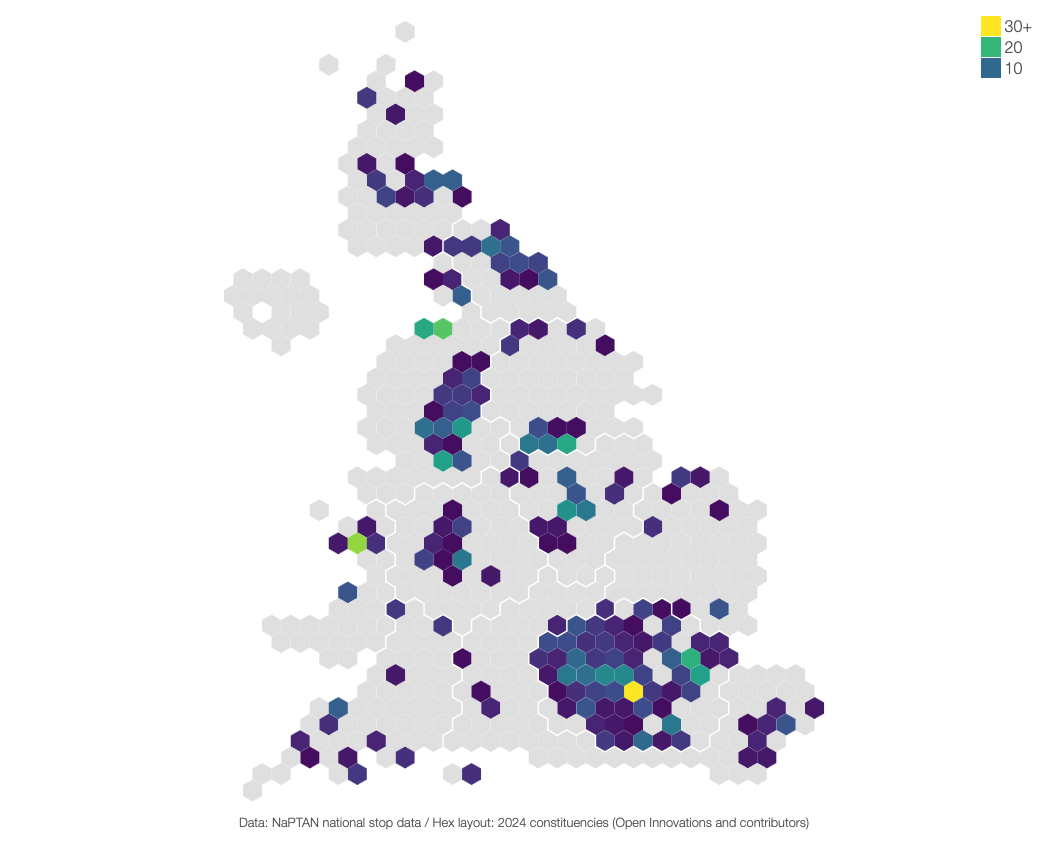
Credit: Open Innovations, NaPTAN
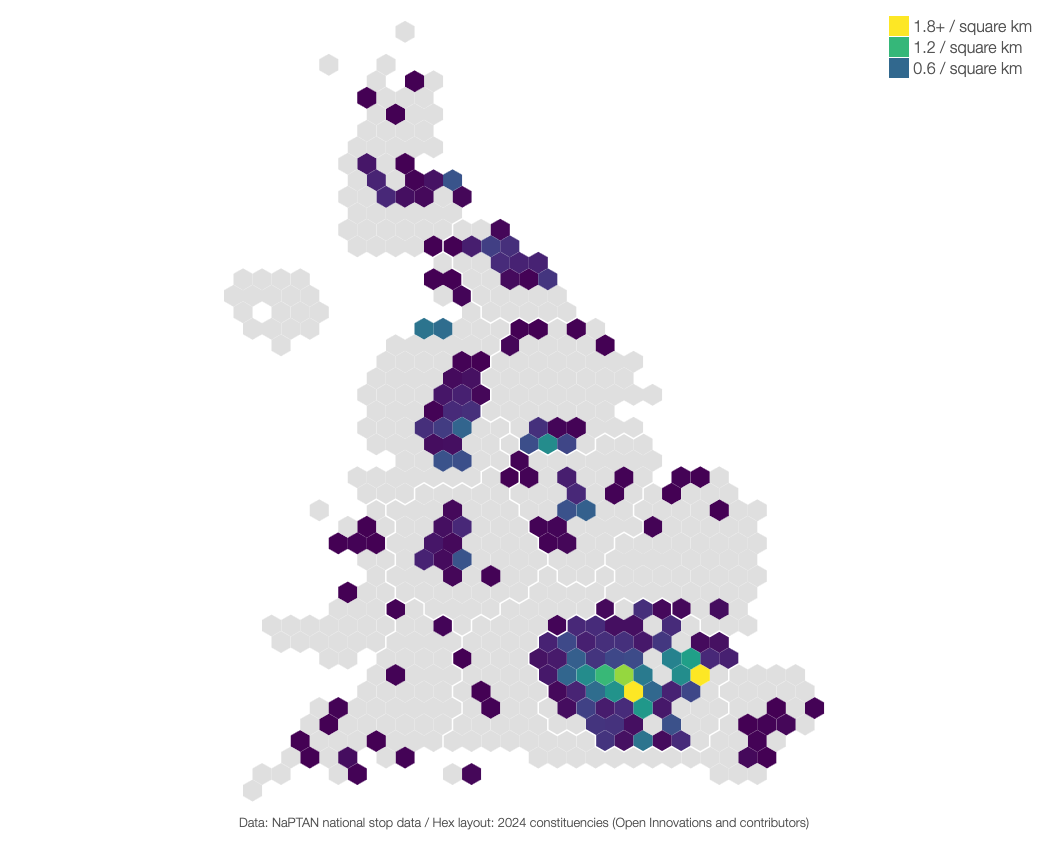
Credit: Open Innovations, NaPTAN
Rail stops (stations)
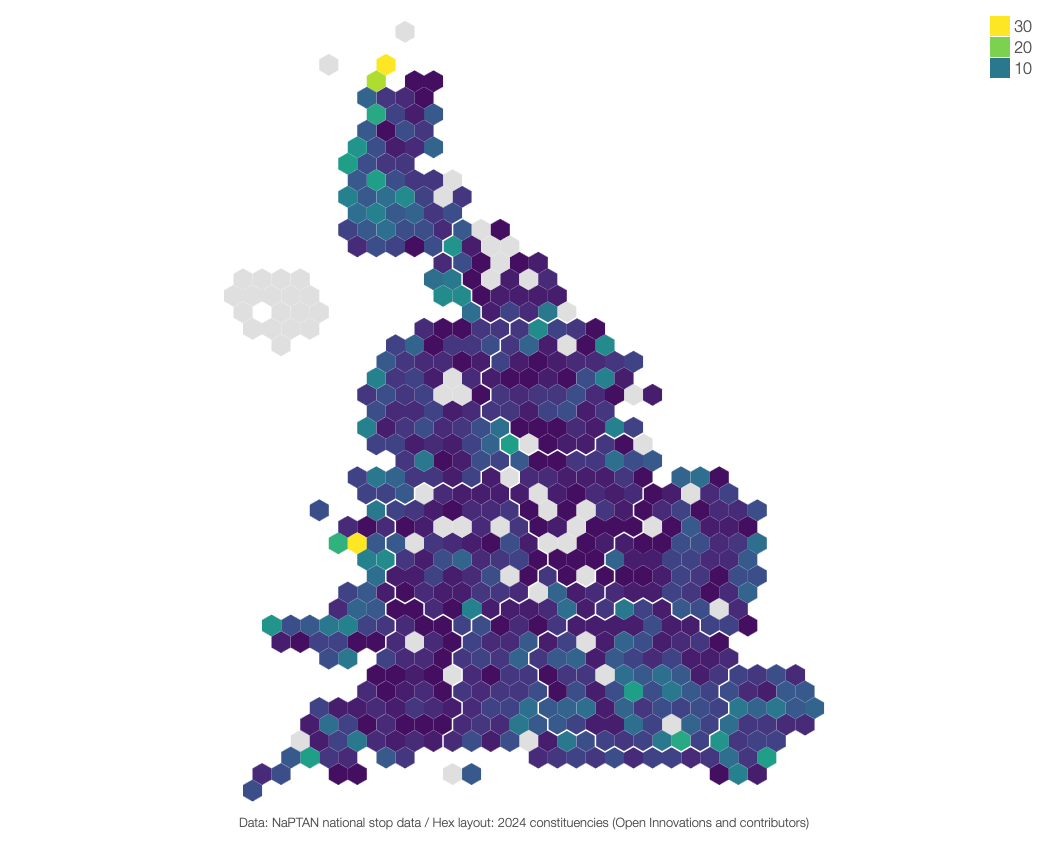
Credit: Open Innovations, NaPTAN
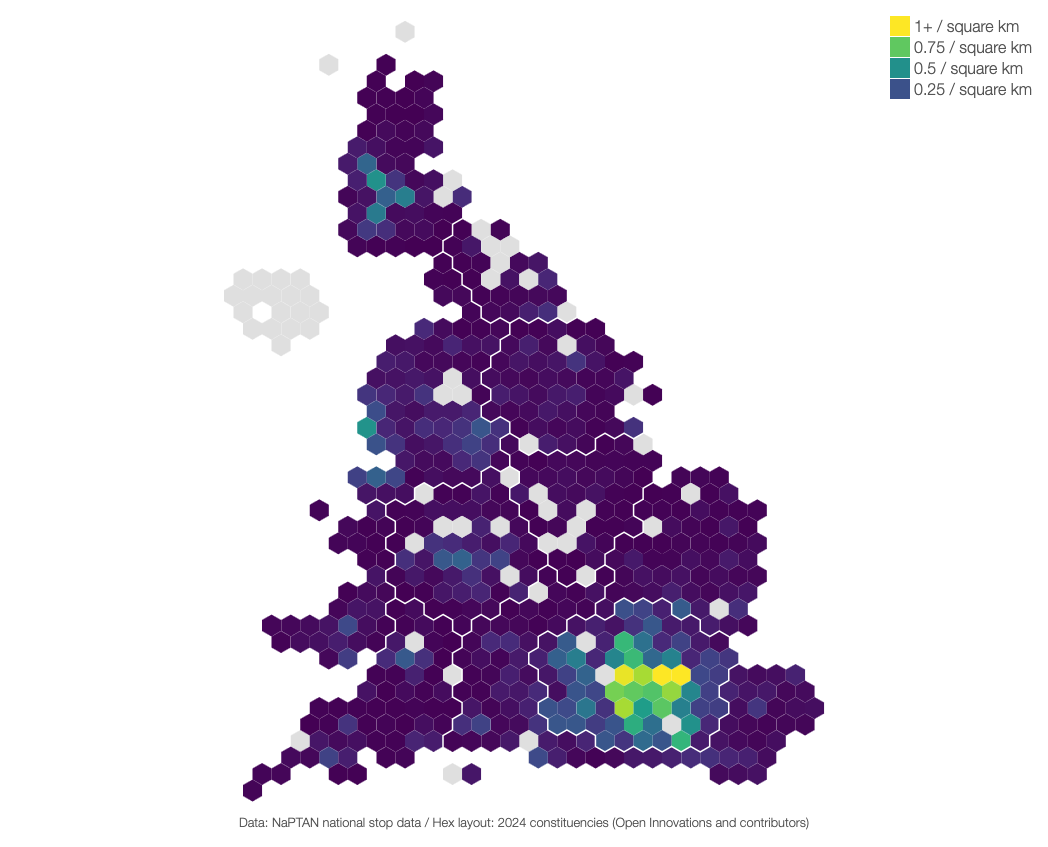
Credit: Open Innovations, NaPTAN
Other cities need mass-transport too
When we normalise for the physical size of constituencies, it's clear that central and Greater London has an advantage over the rest of the country for its density of transport links. There are hotspots of density in bus networks across the UK, but tram/metro and rail networks elsewhere are vastly less dense than in London.
Of the three transport modes shown here, buses are the cheapest to implement, primarily because the infrastructure to run them already exists. But as a nation, if we are serious about growing our economy, then we must allow cities across the UK to build their own mass transit systems to rival London's. Plenty of other countries have done it, and we should too.
If there are any other constituency-based datasets that we haven't already visualised, then please get in touch.
Thanks to our sponsors, who enable us to work on mission-led projects like this.