Earlier this month, Tom and I visited the Royal Automobile Club (RAC) in Pall Mall to talk about buses at the RAC Foundation's event, Data Driven 2025. It was a fantastic day out; we met many transport data enthusiasts between exciting talks on brilliant work that's happening in the field.
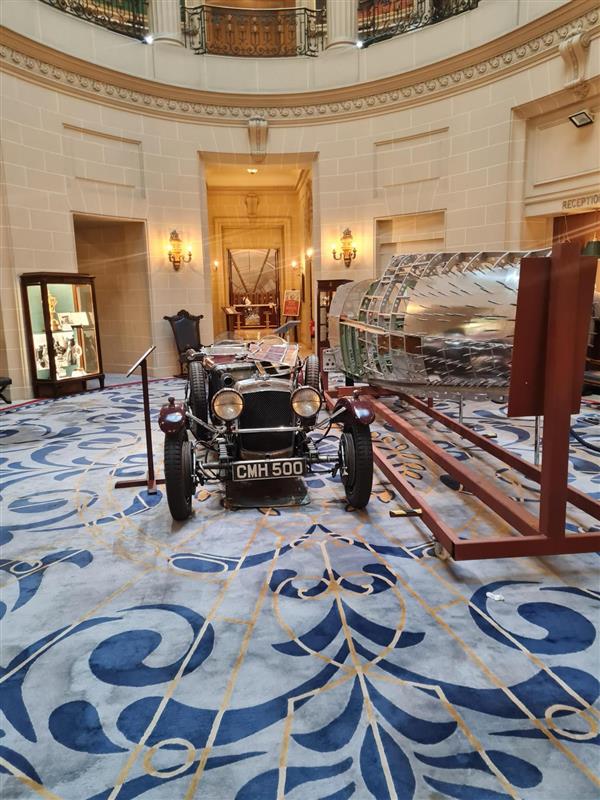
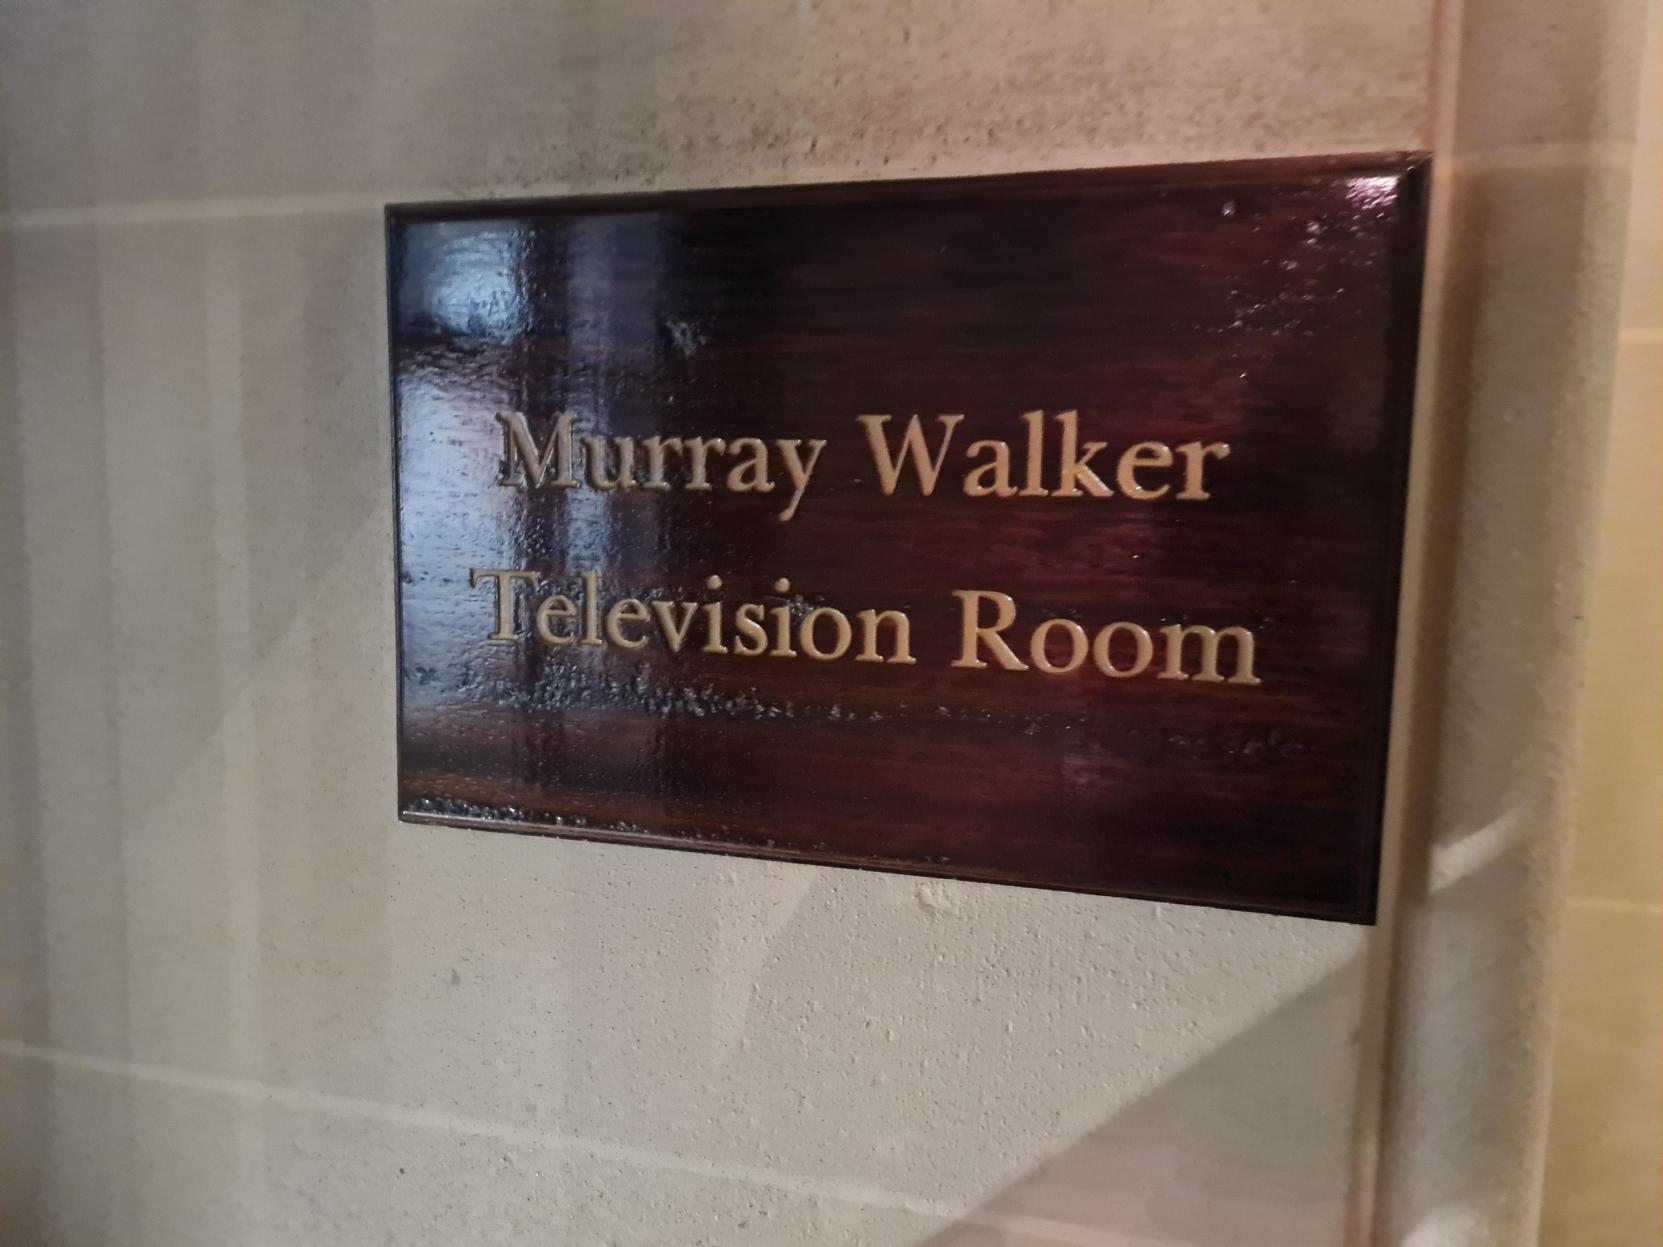
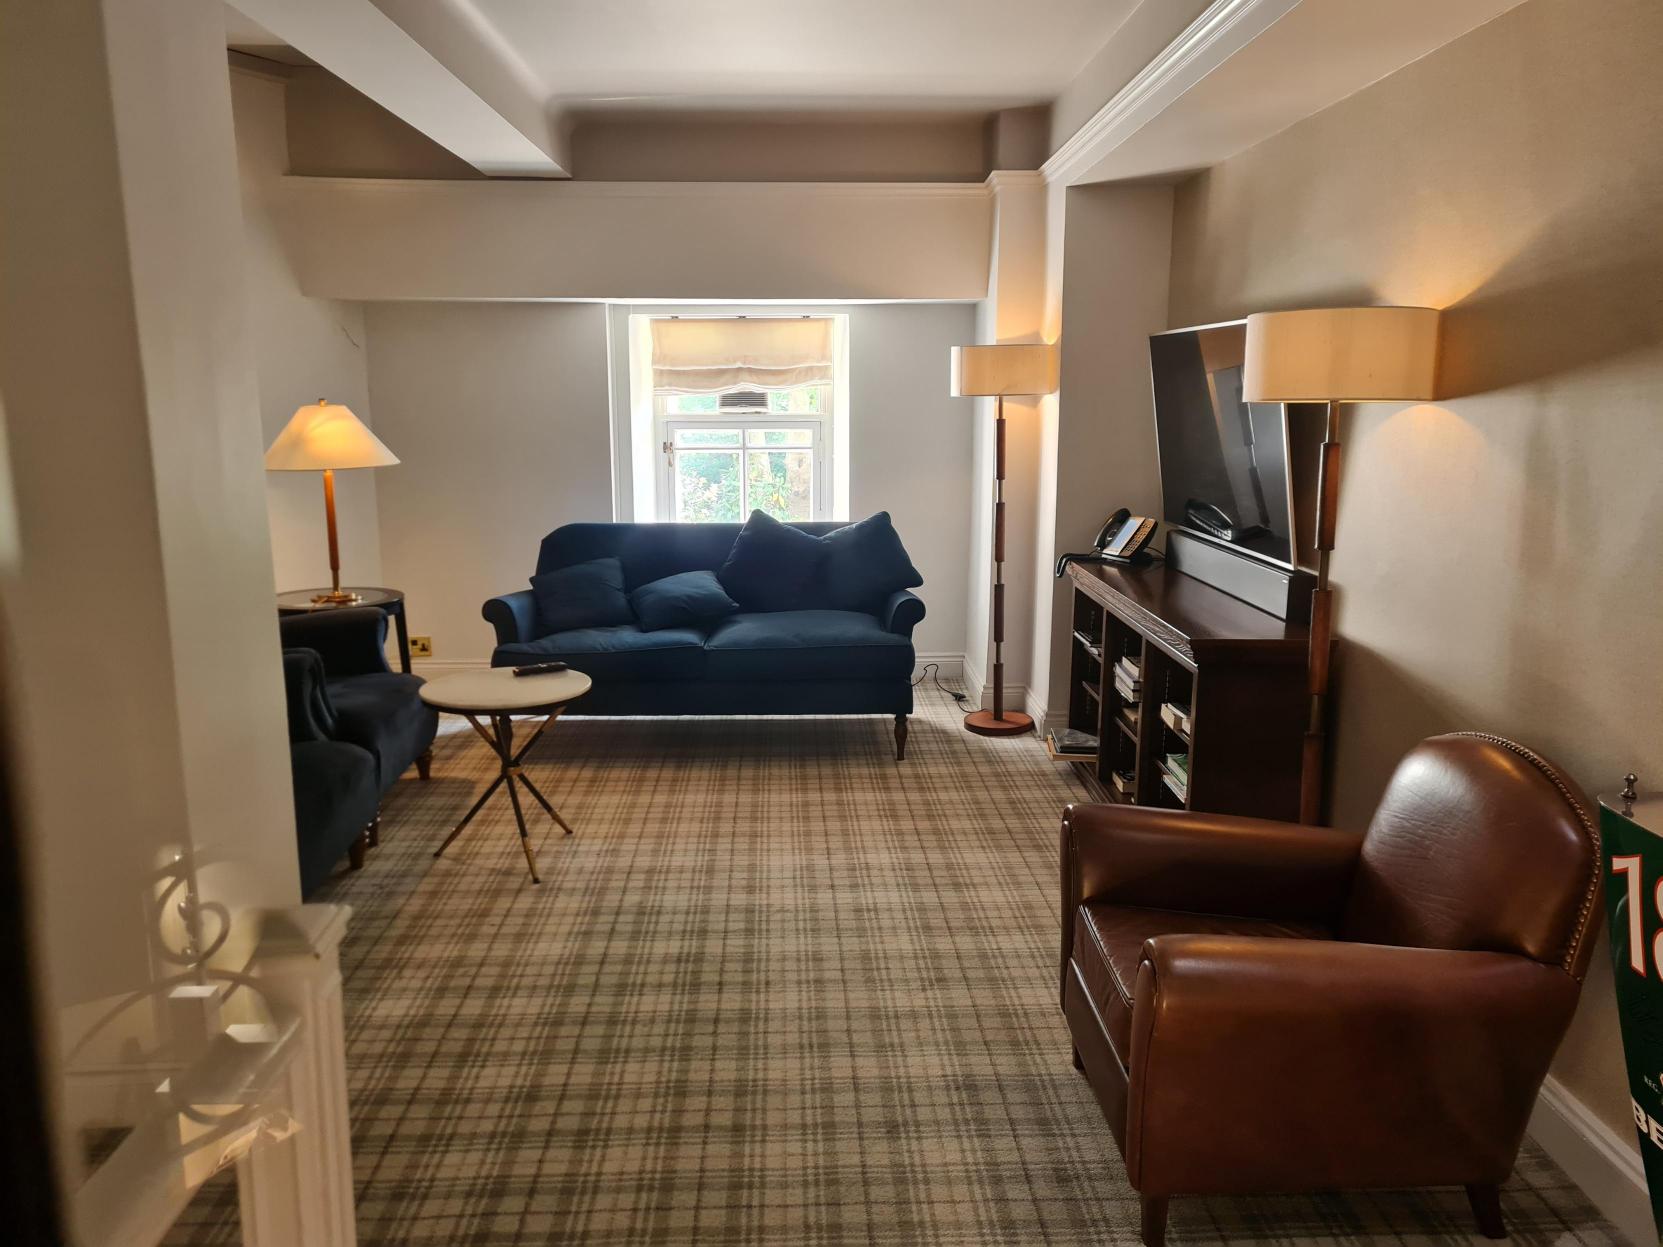
We even had time to appreciate the incredible club at Pall Mall, which is like something from a period drama. The highlights included a 1935 Frazer Nash Shelsley and the carcass of a spitfire in the lobby, and the Murray Walker Television room (for watching TV, of course).
The cheapest parking in Westminster.
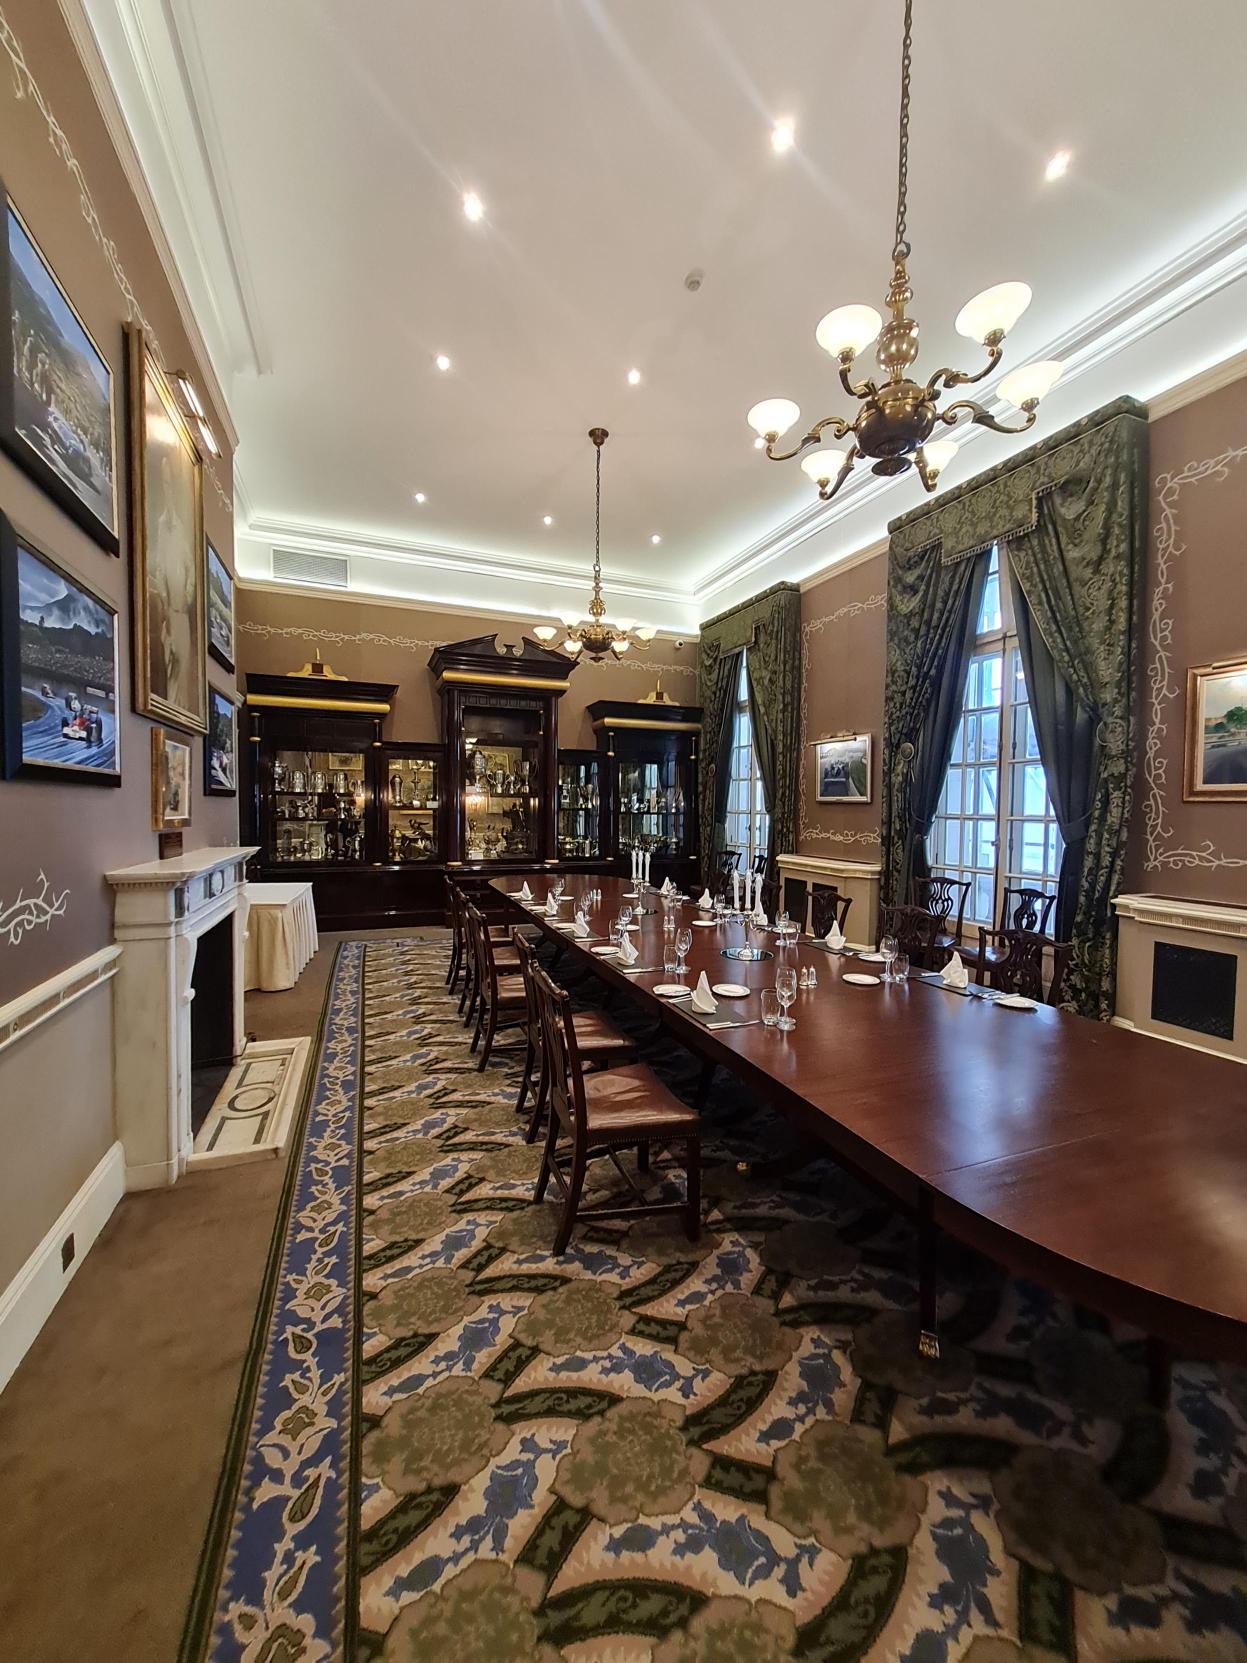
A dedicated television room. A grand dining room with one of the longest dining tables we've seen. Credit: Open Innovations
Last year, Tom attended the 2024 version of this event and talked about tracking the buses. He briefly described his earlier work and talked about how we've done loads more work on buses since then, which was commissioned by Liverpool City Region Combined Authority. The main aims were to update our methodology and collect new data, and produce some outputs for the Liverpool area.
Luke - intro:
After a brief intro of myself and Open Innovations, I explained that we had tracked every bus in Great Britain for two weeks, and that I was going to show them what we did with the data and what we want to do next.
Luke - outputs 1:
We created five interactive maps of travel time isochrones from different bus stations in the Liverpool City region. The maps show where you can get to in 45 minutes on a typical weekday in September 2024, both from the timetable and the real location data. We estimated the populations inside each isochrone. I talked about the importance of the populations later on in this talk.
Unfortunately, we haven't yet been able to share these outputs openly.
Luke - outputs 2:
In doing all that work, we needed a way to debug the data. We also wanted to recreate some charts from Tom's earlier work. As a result, we created a visual web tool that allows you to see the performance of each individual bus route. The tool allows you to select your bus route, pick two stops on the route, and see the journey time of every bus that we tracked.
It's a prototype that currently includes Yorkshire and the Humber, and the North West, but we could do it for anywhere that uses Global Transit Feed Specification (GTFS).
I gave a live demo of the tool which, to my relief, went smoothly. I'll put that down to the many hours we spent fixing all the bugs.
Luke - aims and objectives:
The project was simple in its aims but complex in execution. Most importantly, we switched from SIRI-VM and TransXChange to GTFS and GTFS-RT. We did this because GTFS is a global standard, which means any work we do applies to other parts of the world. Similarly, we benefit from any other open-source work that others have done. This allows us to collaborate more easily, develop faster, and create higher-quality outputs.
In the same vein, I rewrote Tom's C# code in Python, to increase the accessibility of our work and make use of already existing libraries. Python is arguably the most widely-used language for data science, and it's also my native programming language, so it made sense to use for this project.
Lastly, everything for this project has been shared openly through blogs, GitHub, data, and outputs. It's all there for people to use, collaborate, iterate, and more. We are always happy to guide anyone looking to re-use our work. All we ask for in return is an accreditation.
Luke - doing the work:
This project had two main parts. The first was the data and web side of things. We used the Bus Open Data Service (BODS) to download timetables and real-time data. We set up a script to download the real-time data in GTFS format every minute for two weeks.
All the code lives in an open GitHub repository. There are lots of BODS-specific data-quality issues we had to patch, but we are happy to point people in the right direction if they're looking to re-use our work elsewhere.
It's important to say that this work wouldn't have been possible without all the amazing open-source work that has been shared freely. Working in the open allows us to deliver high-quality data science projects at a much lower cost than private consultancy.
Cities with a higher population should have higher productivity because of economies of scale.
This trend occurs in Northern Europe and America, but not in the UK (outside of London).
We think it's partly to do with a lack of public transport infrastructure in the UK's non-capital cities.
If you rely on buses alone, which are affected by traffic, the journey times are highly variable.
This means fewer people can rely on public transport (economies of scale!) to get to work, so either they don't/can't go to work, or they drive, which makes the traffic worse, and we lose the economies of scale.
This is just one part of the UK's productivity problem, but we're confident it matters and affects our cities' productivity.
Luke - next steps:
We know that there is a BODS archive, and we want it to be released publicly. It would be a relatively low-cost way to create a lot of opportunity for new analysis.
We should focus on GTFS because it's a global standard - again, think collaboration and contributing to/benefiting from other people's work.
We can do so much more, including:
Repeating the analysis for other places with GTFS
Add more transport modes to make the analysis more robust
Collect more data and update what we already have
Tom - final remarks:
We can track every bus in Great Britain and do amazing analysis of it. It's really cool and it meshes into so much of the UK government's thinking around growth, inclusion, and devolution.
We also have lots of suggestions for improvement that we'd love to pass on to the BODS team.
In the UK's new AI Opportunities Action Plan, point 7 calls for the UK government to "rapidly identify at least 5 high-impact public datasets it will seek to make available to AI researchers and innovators" and we think the Department for Transport have got one.
BODS has been running for a number of years now. We believe that there is an archive of all of its real-time bus location data. We are confident that this should be releasable under an open licence. And if we can get it released, via our vision for a National Data Library or directly from BODS, our tool should allow analysis, quickly and with not much extra work, of all the buses that have run and been tracked in recent years.
Thank you
A big thank you to the RAC Foundation for inviting us to be part of this event.
'%3E%3C/circle%3E%3C/g%3E%3C/svg%3E)