'%3E%3C/circle%3E%3C/g%3E%3C/svg%3E)
6 months at Open Innovations
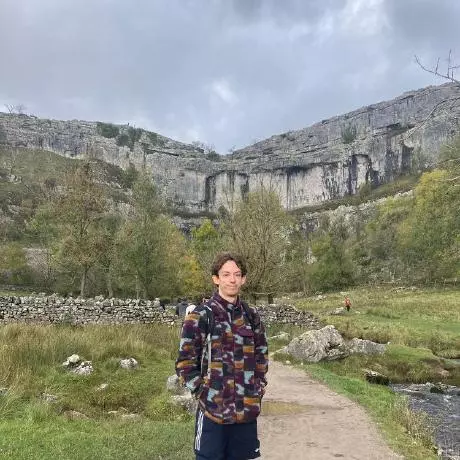
From physics to working in the open
In July 2022, I graduated with a master's degree in Physics. I’d had a great 4 years and was ready to move on, but I wasn’t sure what I wanted to do next. I had a vague idea that I’d like to do something with coding. After applying to several graduate schemes, I found Open Innovation’s approach refreshing. Paul emailed me after finding my CV and asked if I’d like to have a chat about working with them. After an enjoyable interview, I was offered a job starting the following week. It was immediately clear to me that Open Innovations (OI) works fast!
Working in the open felt natural to me because I have never worked on data for a private, closed company. Now I have some experience it feels like a no-brainer. Part of being open is writing blog posts on our work as we go. I didn’t anticipate that I’d enjoy writing blogs as much as I have but it has been one of the most rewarding parts of the job. We get to write up what we’ve been working on and share it with the world. I don’t know of many jobs where, when someone asks what you do or have been up to, you can just send them a link to a blog or website you have created. The ability to share our work so easily makes it easier for people to care. We get to truly speak our opinion (as long as it's based on the data); the blog posts we write are our own. There’s no hidden agenda and we are willing to admit that we can be wrong, or that experiments we try might not work. That is a very liberating feeling.
Learning on the job
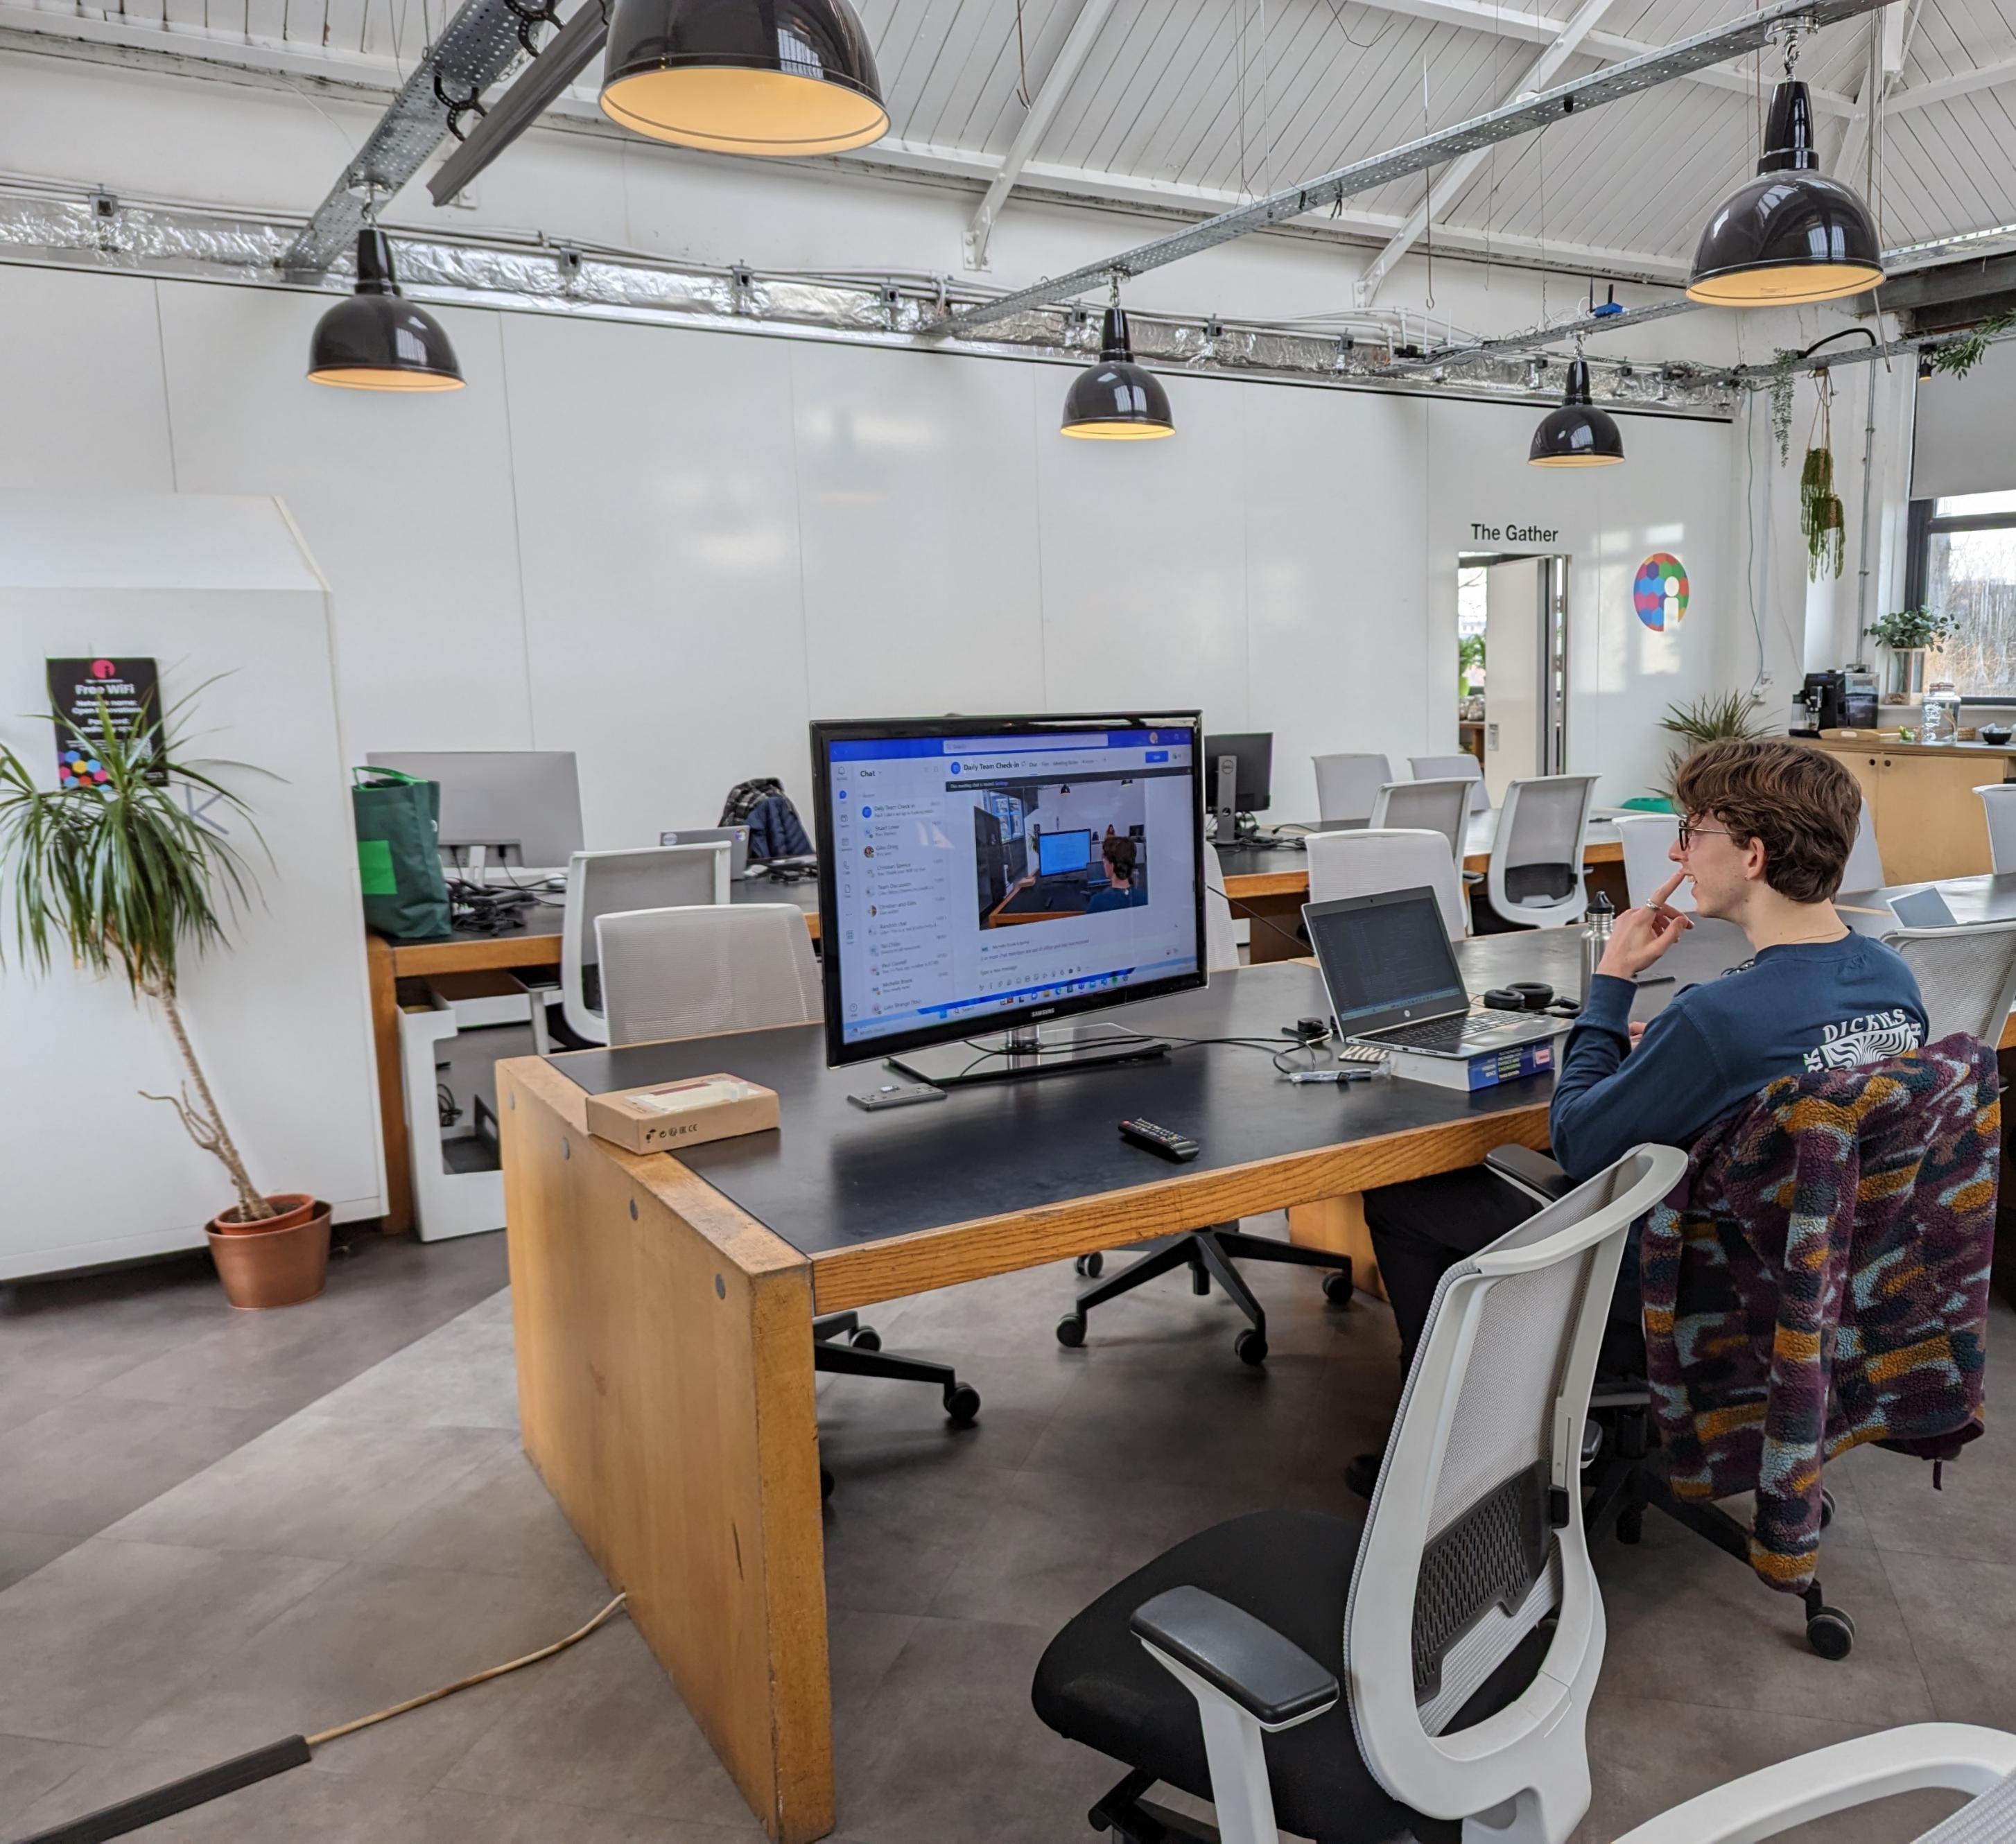
I was already a confident Python programmer, having used it throughout my degree and heavily in my master’s project. Within the first couple of days, I was involved in the Local Skills Improvement Plan project for the West/North Yorkshire Chamber of Commerce. This suited me well because there were several Python-based things that needed doing that I could immediately get involved with. However, I was unfamiliar with website building and design (Lume, Nunjucks, CSS, JavaScript, HTML) and data pipeline management with DVC. These were all chunks of a larger puzzle of how OI works that I needed to learn. I am grateful to OI for giving me a chance to show that I could learn these skills quickly.
Having a physics background, there was also (and still is) a lot for me to learn about economy, politics, socio-economics and geography, but framed within the context of North England. In order to understand OI and our work, it was important for me to learn more about the history of these topics in the North and how we got to where we are now. OI’s history was encapsulated by a blog Paul wrote recently, and Tom Forth’s work on public transport is an example of a project where I learnt how transport affects the Northern economy. In Leeds, public transport is a hotly debated topic. Ghost buses are a thing. Learning how this impacts the overall prospects of a city was fascinating. Because it was all published openly, I could read about it and look at the code (and so could anyone else).
My role
My main role so far has been building data pipelines or data engineering. I take data from many sources and build the infrastructure to connect it to our websites, tools and visualisations, and I try to automate as much of that process as possible. That often includes some processing along the way. Crucially, this gives people time to focus on answering questions with data, rather than wasting time on the busywork of making charts and finding the right data sources. You can read more about why that's useful here.
I have also learnt how to put things on the web by building and designing static websites using HTML, JavaScript, CSS and Lume. It has also been interesting working using delivery sprints, with a ticket board to allocate tasks. For anyone who has worked in hospitality, it’s similar to tickets in a restaurant kitchen. A lot of the team works remotely, so having a bunch of tickets describing tasks and their progress makes it easier to manage the workload.
My role is not purely technical, however. Since we are a small team, I also speak directly to clients and sponsors to bring their ideas to life and present our work. This commands a different set of skills, which I have had to learn along the way. I’d summarise these as turning ideas from meetings and working sessions into actionable tasks; knowing how to manage client expectations; creating a positive working relationship with clients; and presenting technical work to non-technical people. I’ve also attended a handful of hacks and working sessions including a No Code Super Hack and a session at Munro House with Northern Powergrid.
Stuff I've done
Most of my time has been spent across 4 different projects. These were:
- Local Skills Improvement Plan (LSIP) data site for the West and North Yorkshire Chamber of Commerce - we built a site to visualise data on education and skills in West and North Yorkshire to help inform decision making.
- Youth Futures Foundation (YFF) - we built a site that automatically visualises the latest youth labour market data.
- Joseph Rowntree Foundation (JRF) - we are building a site that connects data on poverty through a geographical lens focusing on the North. The site automatically collects the most recent poverty-related data and tries to present actionable insights.
- Lowr - I found up-to-date and reliable data on travel emissions and put it in one place. I also discussed the problems with the world of carbon emissions data.
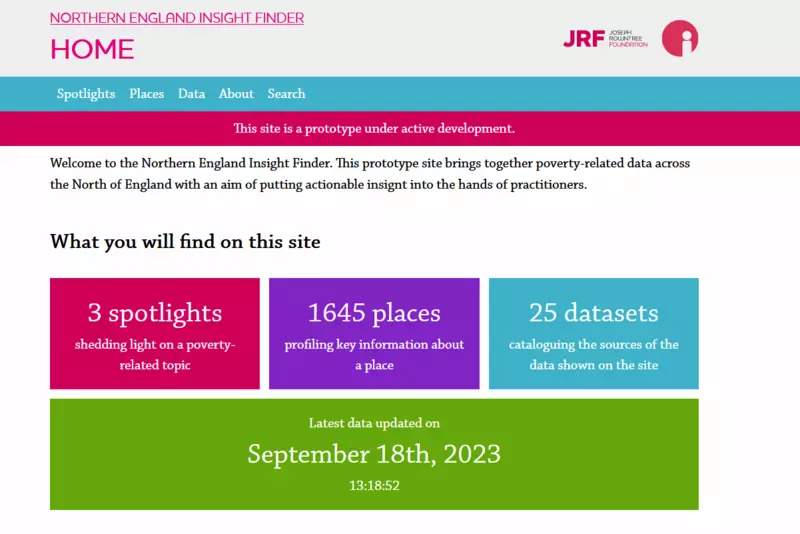
I’ve written a handful of blogs explaining the work mentioned above:
- What does LSIP Stand for?
- Can Data Fix Poverty?
- Cleaning up Carbon Emissions Data
- Open Travel Emissions Data
All of this work is connected, and by working in the open we can continue to build on what we’ve done previously. That is a unique power and something I hadn’t considered before working here. In the future, I’d like to use more of my analytical and modelling skills to complement what I’ve learnt about data engineering, visualisation and putting data on the web. There are so many opportunities to use and combine open data to tell us new information about how we improve the North of England.
I have learnt so much from the OI team, so I’ll finish this blog with something I have learnt from each person as a bit of a thank you:
- Christian Spence - the intricacies of GIS and economic data.
- Giles Dring - immense technical wizardry and writing better code.
- Kathryn Connell - organising and running great events for sponsors and clients.
- Louis Connell - sharpening my blog writing tools.
- Michelle Brook - effective running of projects and client relationships.
- Paul Connell - how to do more and talk less.
- Stuart Lowe - scrutinising data and considering the wider impacts and accessibility of our work.
- Tazmin Chiles - turning ideas and discussion with our clients and sponsors into action.
- Tom Forth - creating simple solutions using data to answer complex problems.
(By the way, the names are in alphabetical order)
What's next?
At the start of October I'll be leaving OI to travel. I'm starting in Mexico and working my way down through Central America (and maybe into South America depending on money / time). Although I am sad to leave what has been a brilliant job, I am looking forward to exploring a new part of the world and thinking about what I want to do in the future. Hopefully there will be a role for me to work with OI on my return, if they'll have me!